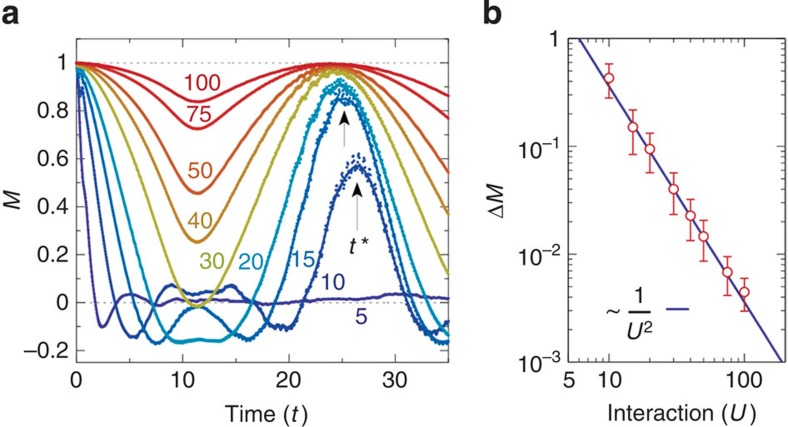
Figure 4. Quality of the time reversal.
(a) Time evolution of the staggered magnetization M in a 10-site Hubbard chain, where after fixed forward propagation time tf=10 the field is ramped up within a time interval Δt=10. Different colours correspond to different values of U, as indicated by the corresponding coloured labels. (b) Difference ΔM between the initial staggered magnetization and the staggered magnetization at the revival time t* as a function of U. The error bars represent the magnitude of the short-time fluctuations of M close to t*. In all calculations, the driving frequency ω/U=0.6 and Floquet amplitude  were used.

