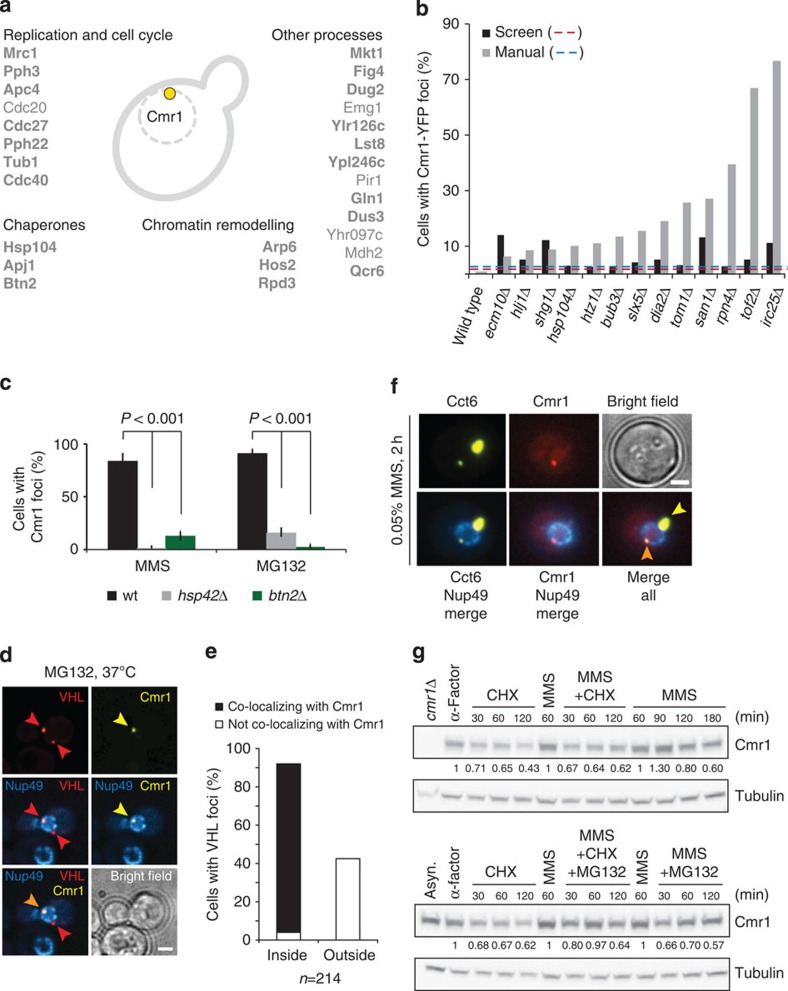
Figure 3. Characterization of INQ.
(a) Genome-wide analysis of Cmr1 co-localizing proteins. Haploid cells expressing GFP-tagged query proteins and Rad52-RFP as a nuclear marker (IG72-5C) were imaged by high-content fluorescence microscopy, untreated or treated for 2 h with 75 μg ml−1 MG132. Proteins re-localizing into perinuclear foci were further tested for co-localization with Cmr1. Confirmed co-localizing proteins are listed. Proteins that also co-localize with Cmr1 after MMS treatment are highlighted in bold. (b) Cmr1 foci are induced by genetic impairment of proteasome function. Gene deletion strains expressing Cmr1-YFP and NLS-yEmRFP were imaged by high-content fluorescence microscopy. Strains exhibiting more than threefold increase in the percentage of spontaneous Cmr1 foci compared with wild type were manually retested. Only the mutants giving a result significantly different from the wild type are reported in the figure. Six mutants (arp6Δ, slx1Δ, fpr1Δ, whi2Δ, sgs1Δ and csm2Δ) exhibited elevated Cmr1-YFP foci levels in the screen, but not on manual retesting. Red and blue dashed lines represent the threefold thresholds for the automated and manual analyses, respectively. IG66 served as the wild-type reference strain for the manual re-testing. (c) Cmr1 foci are dependent on Hsp42 and Btn2. Cells deleted for BTN2 (IG239-2B) or HSP42 (IG238-9D) and expressing Cmr1-YFP were treated with MMS or MG132 for 2 h. Two to 3 replicates of 100–200 cells were analysed for each condition. Error bars represent 95% confidence intervals. (d) Cmr1 defines INQ. Cells expressing Cmr1-YFP (IG66), Cherry-VHL (pESC-mCherry-VHL) and Nup49-CFP (pNEB21) were grown at 25 °C to log phase in synthetic complete medium lacking tryptophan and uracil, and with 2% raffinose as a carbon source. Cherry-VHL expression was induced by addition of 3% galactose for 3 h, followed by a shift to 37 °C and treatment with 75 μg ml−1 MG132 in 2% glucose for 1 h before imaging. Arrowheads mark VHL and Cmr1 foci. Images were deconvolved using the Volocity software (PerkinElmer). Scale bar, 2 μm. (e) Quantification of the foci described in d. Cherry-VHL foci (n=214) located inside and outside the nuclear periphery were assessed for co-localization with Cmr1-YFP. (f) Cmr1 and the CCT–chaperonin complex co-localize at perinuclear foci. Cells express Cmr1-yEmRFP (IG111), Nup49-CFP (pNEB21) and Cct6-YFP (pIG20). Orange arrowhead, Cmr1 and Cct6 co-localizing at a perinuclear focus. Yellow arrowhead, Cct6 focus. Scale bar, 2 μm. (g) Cmr1 is not degraded during the DNA-damage response. G1-arrested cells (IG174) were released into YPD containing 200 μg ml−1 cycloheximide (CHX) or 0.05% MMS. After 60 min of MMS treatment, CHX and 75 μg ml−1 MG132 or CHX and MG132 were added. Cmr1-TAP and tubulin were analysed by immunoblotting, using cmr1Δ (DP1) as a negative control. Cmr1 protein levels relative to the sample taken before addition of CHX are indicated below the blot.

