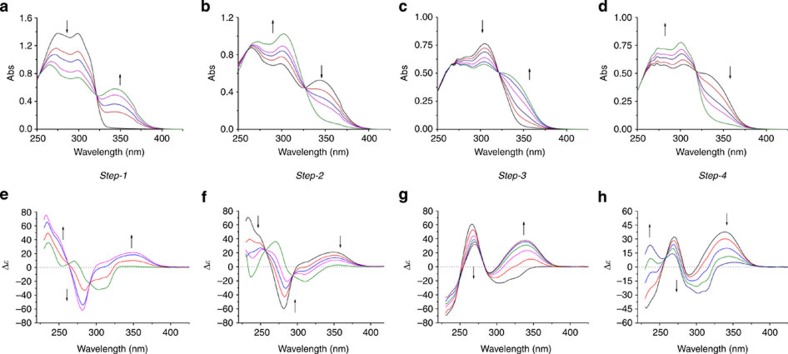
Figure 4. Ultraviolet–visible and CD spectral changes of L2 in each isomerization step.
(a) Ultraviolet–visible spectral changes during step-1 on irradiation at 312 nm in THF at −15 °C. (b) Ultraviolet–visible spectral changes during step-2 on heating in THF at 60 °C. (c) Ultraviolet–visible spectral changes during step-3 on irradiation at 312 nm in THF at −60 °C. (d) Ultraviolet–visible spectral changes during step-4 (t½=11 min at 0 °C) in THF at 0 °C. Isosbestic points of step-1 to step-4: 321, 327, 322 and 318 nm. (e–h) The corresponding CD spectral changes during each of the four isomerization steps, respectively.

