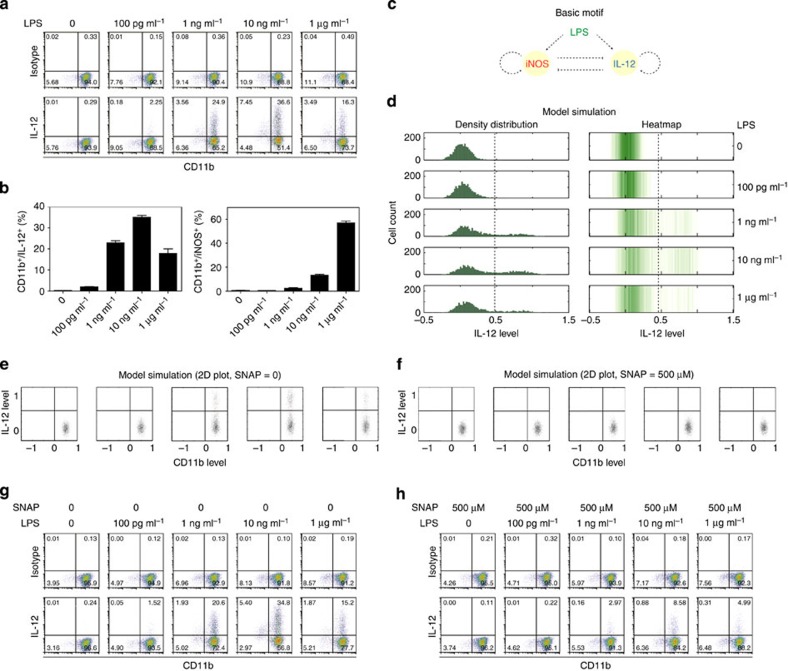
Figure 7. Dynamic modulation of IL-12 expression by iNOS in macrophages.
(a) BMDMs were treated with different doses of LPS overnight, and then re-stimulated with PMA (20 ng ml−1) and ionomycin (1 μg ml−1) in the presence of monensin (2 μM) for 4 h. The surface expression of CD11b and intracellular expression of IL-12 was examined by flow cytometry. The quadrant gates were created based on the staining of isotype matched antibodies. (b) Quantitation of the expression levels of IL-12 (left panel) and iNOS (right panel) by varying dosages of LPS. (c) The basic motif of iNOS and IL-12 competition. (d) The converted heatmaps of the distribution of IL-12 expression. In agreement with experimental observation, the percentages of IL-12-positive cells have a biphasic behaviour under LPS treatment. (e) Model predicts that NO donor can attenuate the biphasic dynamics of IL-12 under treatment of increasing LPS. (f) Model simulation of IL-12 expression when 500 μM SNAP (a NO donor) was applied. A total number of 2,000 cells are simulated with different LPS level (0, 0.1, 1, 10 and 1,000 ng ml−1). (g,h) BMDMs were treated overnight with LPS in the presence of vehicle control (g) of SNAP (h). IL-12 expression was analysed within the CD11b+ population. The quadrant gates were created based in the staining of isotype matched control antibodies. The data are representative of three similar experiments.

