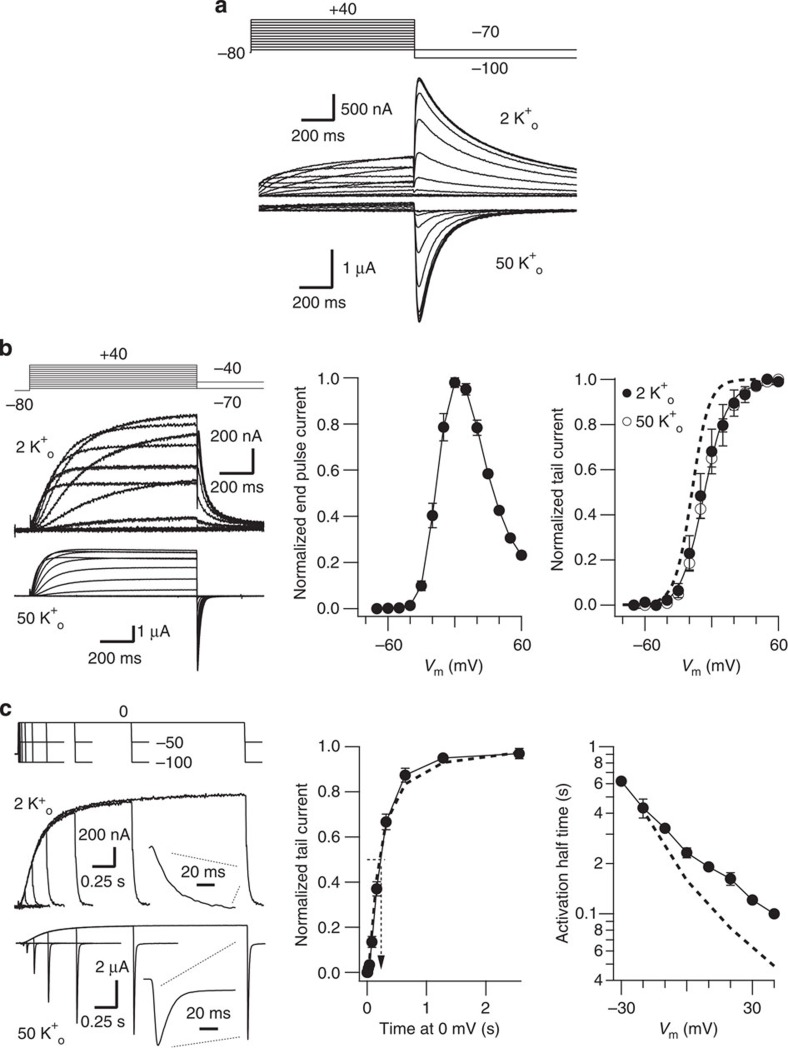
Figure 6. Functional expression and activation kinetics of continuous and Y545 Split KV11.1 (HERG) channels.
(a) Representative current traces of continuous wild-type HERG channels in response to the protocol shown at the top. Extracellular medium containing 2 and 50 mM KCl was used as indicated. (b) Voltage-dependent activation of Y545 Split KV11.1 channels. Left, raw current traces recorded in 2 and 50 mM extracellular K+ in response to 1 s depolarization pulses between −70 and +60 mV at 10 mV intervals from a holding potential of −80 mV, followed by a repolarizing step to −40 (2 mM K+) and −70 (50 mM K+) mV. Centre, averaged I versus V relationship measured at the end of the depolarization step in 2 mM external K+ (n=8). Note the typical n-shaped curve due to the strong rectification as a result of the typical KV11.1 slow activation and fast inactivation overlap at positive voltages. Right, plots of normalized peak tail currents as a function of depolarizing voltage in 2 (closed circles) and 50 mM (open circles) extracellular K+ (n=13). A curve from wild-type continuous KV11.1 channels obtained in the same conditions is shown as a dashed line for comparison. (c) Y545 Split KV11.1 voltage-dependent activation rates. Left, time course of current activation at 0 mV in 2 (top traces) and 50 mM (lower traces) extracellular K+. The duration of a depolarizing prepulse from a holding potential of −80 mV was varied and followed by a repolarization step to −50 and −100 mV in 2 and 50 mM external K+, respectively. An enhanced view of the tail currents at the end of the 2,560 ms depolarizing steps is shown in the insets. Centre, plot of normalized tail current magnitude versus depolarization time at 0 mV (n=4). The plot was used to measure time necessary to attain half-maximum current magnitude (dashed arrow). Note the sigmoidal nature of the early activation time course during the initial tens of ms. Right, dependence of activation rates on depolarisation membrane potential (n≥4). Values from wild-type non-split channels are shown as a dashed line for comparison. Error bars represent s.e.

