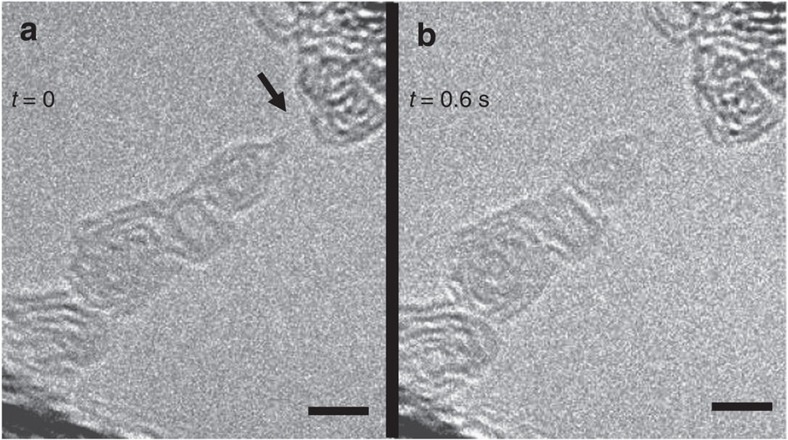
Figure 2. Rupture of a carbon chain.
(a) shows the chain (arrowed) of Fig. 1c where a new time zero is defined. (b) shows the situation after 0.6 s; the chain has ruptured. The relaxation of the bottom contact towards the upper left corner of the image in b demonstrates that the chain has been under mechanical stress. Scale bar, 2 nm.

