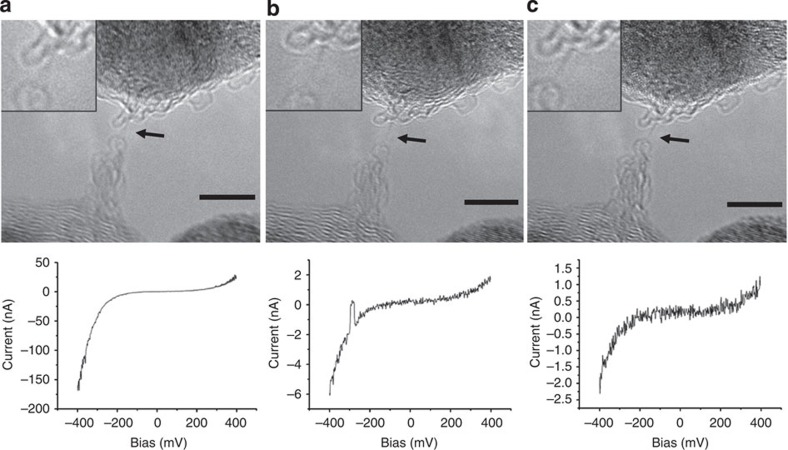
Figure 4. Carbon chain between two different contacts.
The temporal evolution is shown: (a) t=0; (b) t=6 s; (c) t=16 s. The current–voltage curves show an asymmetric shape, which is typical for rectifying behaviour. (The hump in the middle curve is because of an instability of the contacts, while the I/V curve has been recorded). Scale bar, 5 nm.

