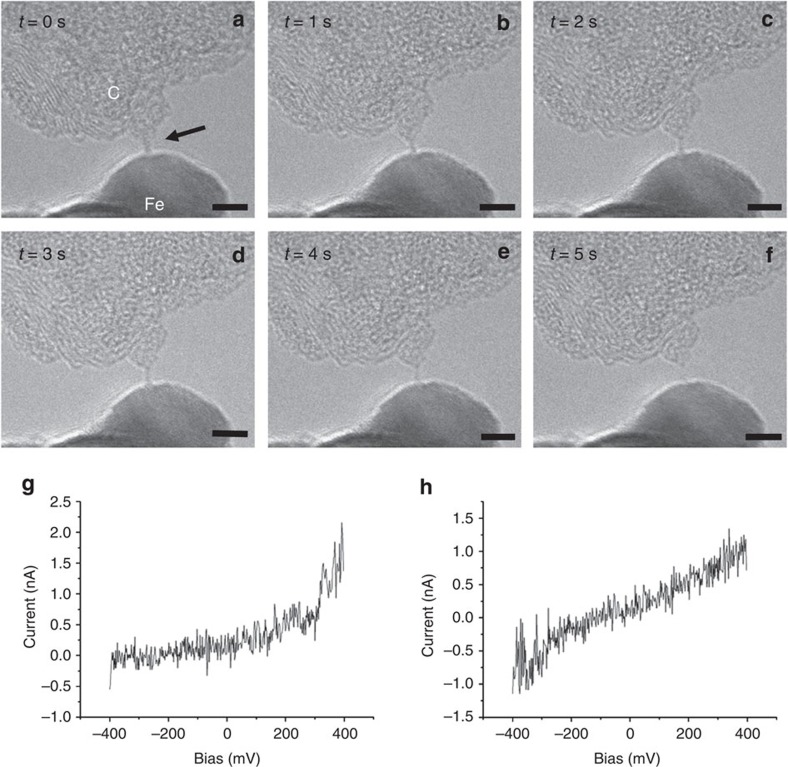
Figure 6. Carbon chain between a Fe contact and a graphitic aggregate.
TEM images (a–f) at different times (indicated) are shown. While the images do not show a visible change in morphology, two current–voltage curves (g,h) taken at different times during the recording of the image series show rectifying (g) versus ohmic (h) behaviour. This can be explained by a sudden release of strain due to a slight movement of one of the electrodes, leading to a semiconductor–metal transition in the chain. Scale bar, 5 nm.

