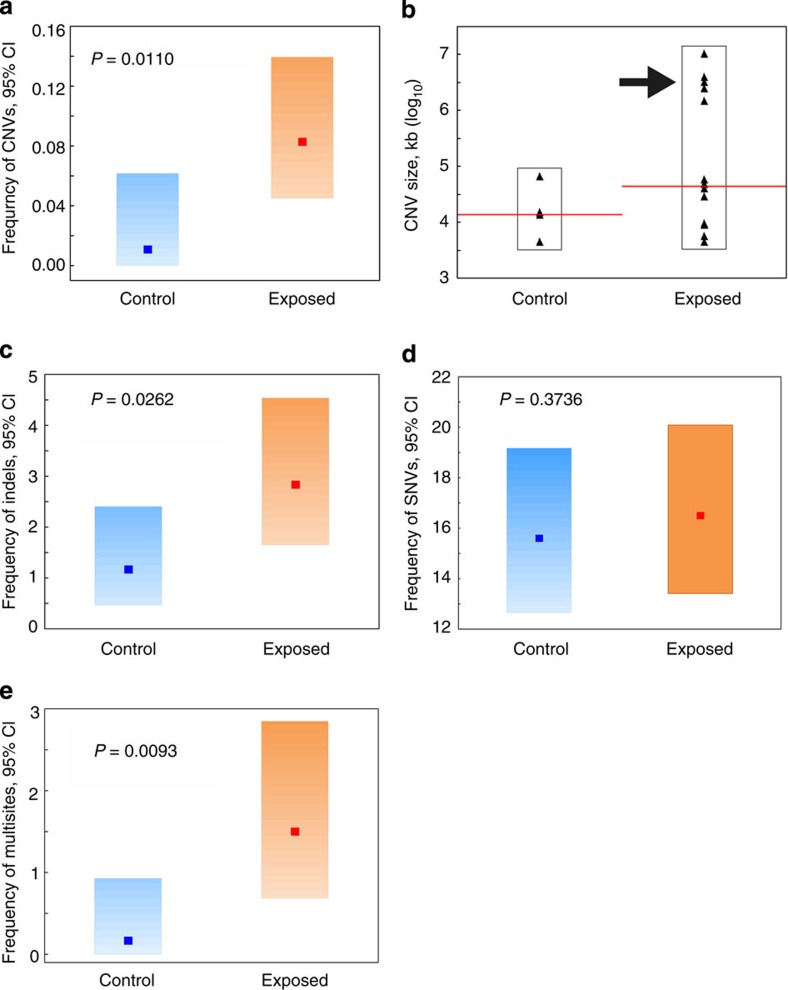
Figure 3. De novo mutation frequencies and spectrum.
(a) Frequency of de novo CNV mutations in the offspring of control and irradiated males. (b) Variability plot showing the spectrum of de novo CNV mutations in the offspring of control and irradiated males (P=0.1533, Kruskal–Wallis test). The median values are shown in red; a group of very large CNVs found in the offspring of irradiated males (>1,000 kb) is arrowed. (c) Frequency of de novo indel mutations in the offspring of control and irradiated males. (d) Frequency of de novo SNV mutations in the offspring of control and irradiated males. (e) Frequency of de novo multisite mutations in the offspring of control and irradiated males. The frequency of de novo mutations per offspring and probability of difference from controls is shown on all graphs. For CNVs the probabilities were estimated using Fisher’s exact test; for SNVs, indels and multisites, the probabilities were estimated using a one-tailed test based on Poisson simulation of mutations in exposed and control populations (Methods). CI, confidence interval.

