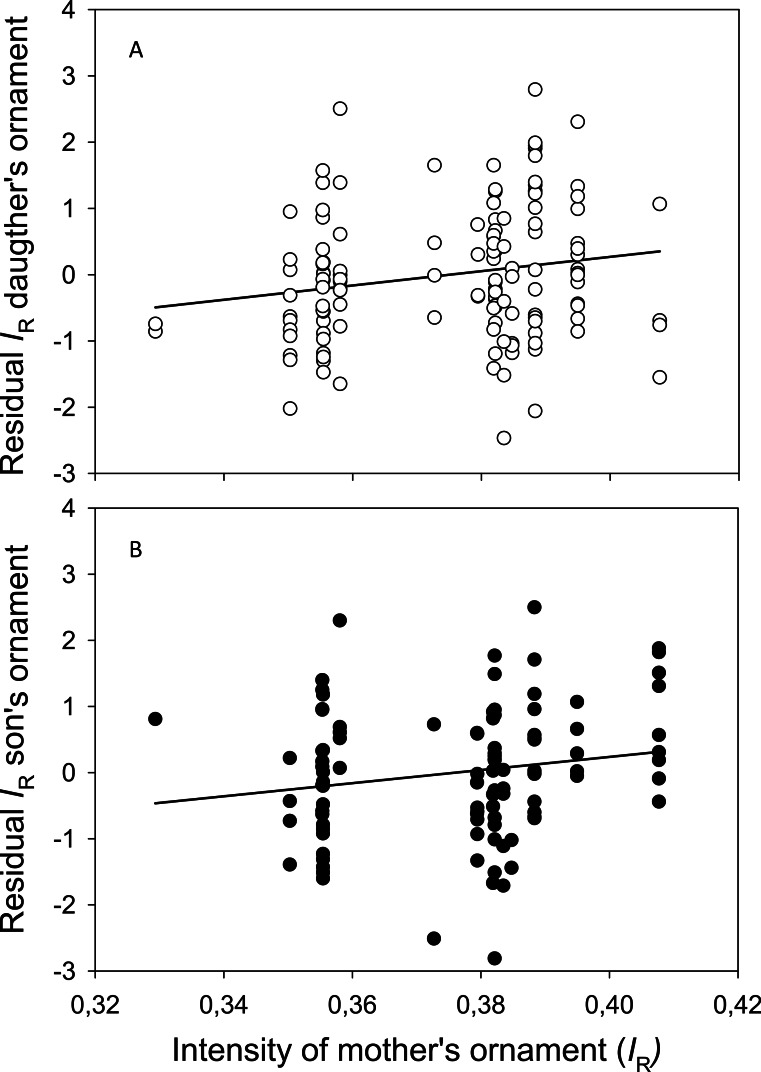
Figure 6. Association between ornaments in mothers and their offspring.
Scatter plot of the intensity of the red pelvic spines (IR) of (A) mothers and daughters and (B) mothers and sons, and their linear regression lines. Y-axis shows residuals of IR after adjusting for length of the (A) daughters and (B) sons.

