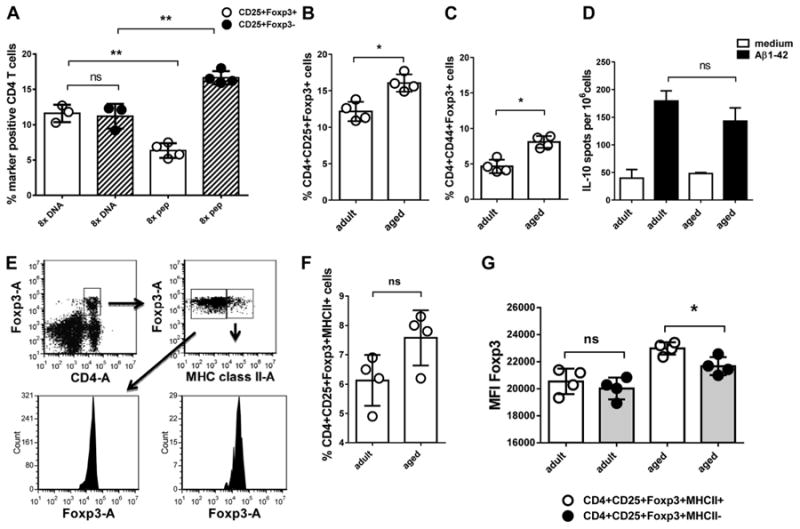
Fig. 2.

Analyses of the regulatory immune response in adult and aged mice. This figure shows the analyses of CD4+CD25+Foxp3+ cells by flow cytometry and IL-10 secreting cells measured by ELISPOT from 2 different mouse strains. In A, percentages of CD4+CD25+Foxp3+ cells were compared in 15-month-old DNA Aβ42 and Aβ42 peptide immunized B6SJLF1 mice which had received 8 DNA Aβ42 or Aβ42 peptide immunizations, respectively. In B–G, DNA Aβ42-immunized adult and aged Balb/c-Foxp3-EGFP mice were compared, which had received 4four DNA immunizations (n = 4/group). B shows a comparison of the percentages of CD4+CD25+Foxp3+ T cells. In C, the memory T cell marker CD44+ is included in this comparison. In D, IL-10 secretion from adult and aged splenocytes restimulated with Aβ42 peptide was measured by ELISPOT. In E, the gating strategy for the analyses of MHC class II positive Tregs is illustrated (indicated by arrows and boxed cell populations) and shown in F. In G, expression densities (MFI) for Foxp3 were compared on MHC class II negative and positive Tregs for which the gating is also shown in E. ** (p<0.005), * (p<0.05), ns (p>0.05). Abbreviation: MFI, mean fluorescence intensities.
