Figure 2.
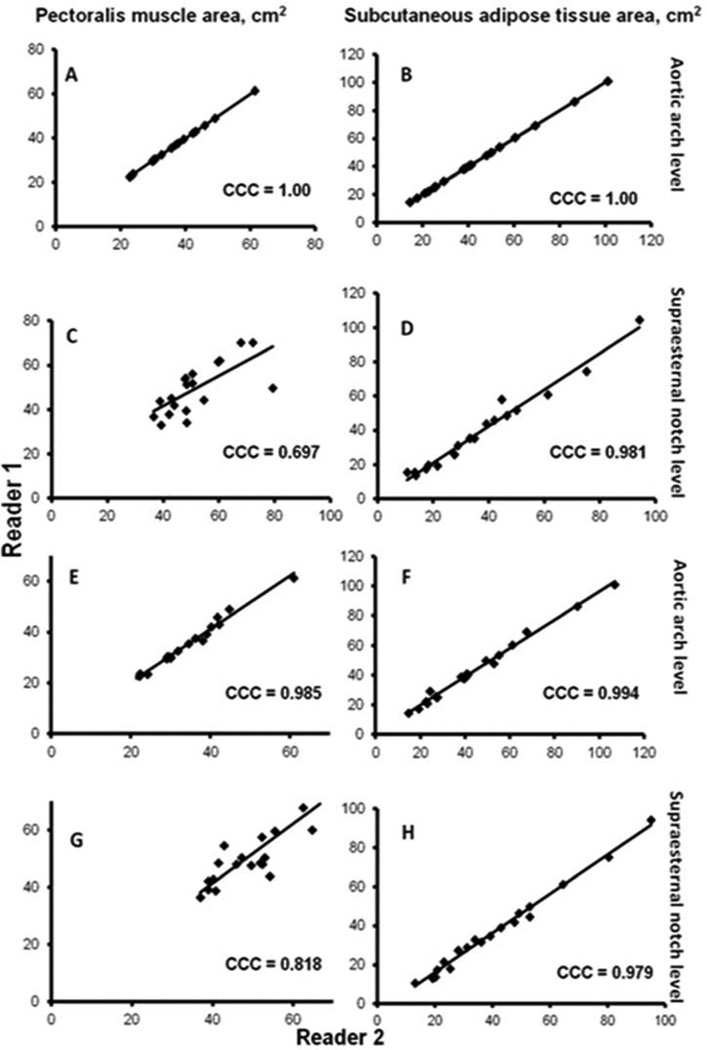
A Regression line plots and the concordance correlations coefficients (CCC) values of the reproducibility of pectoralis muscle area (PMA) and subcutaneous adipose tissue area (SAT) measurements between two readers. The intra-reader reproducibility of PMA at aortic arch (A) and supraesternal notch levels (C) and of SAT (B, D) are shown. Corresponding plots and CCC values for inter-reader reproducibility of PMA at aortic arch (E) and supraesternal notch levels (G) and of SAT (F, H) are also shown.
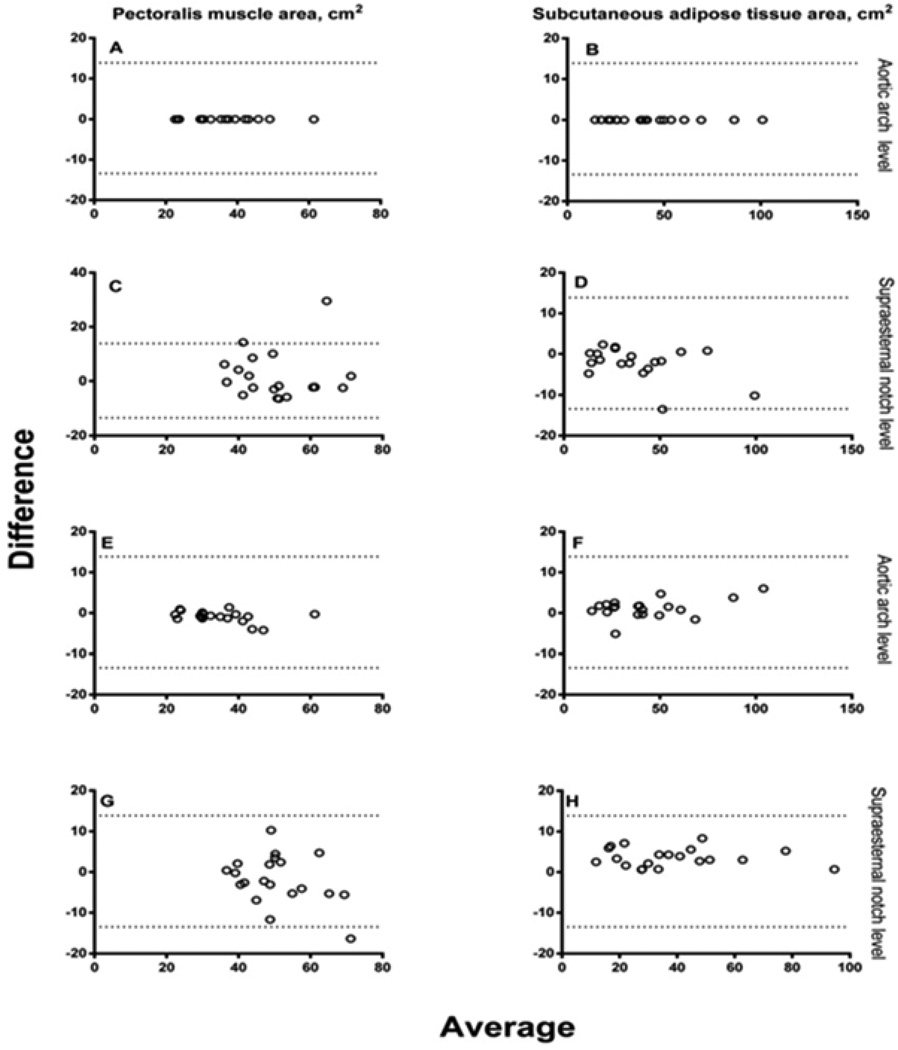
B Bland-Altman plots of the reproducibility of pectoralis muscle area (PMA) and subcutaneous adipose tissue area (SAT) measurements between two readers. Dotted lines represent the 95% confidence intervals. Plots for intra-reader reproducibility of PMA at aortic arch (A) and supraesternal notch levels (C) and of SAT (B, D) are shown. Corresponding plots for inter-reader reproducibility of PMA at aortic arch (E) and supraesternal notch levels (G) and of SAT (F, H) are also shown.


