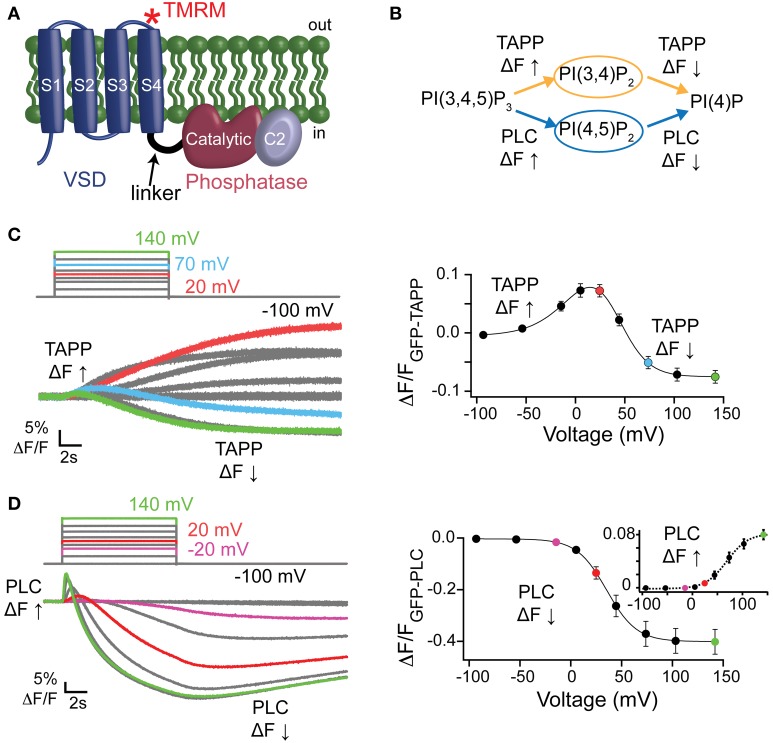
Figure 1.
Activity of Ci-VSP in oocytes using PIP sensitive PH domains. (A) Cartoon of VSP with the VSD, linker, catalytic and C2 domains labeled. Asterisk depicts location of the TMRM probe (G214C-TMRM). (B) VSP reactions where the PI(3,4)P2 sensitive GFP-TAPP-PH monitors the upper reactions (orange) and the PI(4,5)P2 sensitive GFP-PLC-PH monitors the lower reactions (blue). (C, left) Representative GFP-TAPP-PH traces for WT* Ci-VSP during several voltage steps from a holding potential (hp) of −100 mV and with recovery time between each step. A fluorescence increase indicates an increase of PI(3,4)P2 on the membrane while a fluorescence decrease indicates a decrease of PI(3,4)P2 on the membrane; 20 mV = red, 70 mV = cyan, 140 mV = green. The fluorescence may keep changing even after the end of the voltage step. This is a function of the affinity of the PH domain and not an indication of voltage independent Ci-VSP activity. (C, right) ΔF/F TAPP fluorescence vs. voltage relationship (FV) with the fluorescence increase (net 5-phosphatase reaction) predominating at lower voltages and the fluorescence decrease (net 3-phosphatase reaction) predominating at higher voltages. Data fit with a double Boltzmann equation. (D, left) Representative traces of GFP-PLC-PH co-expressed with WT* during several voltage steps as in (C). The fluorescence increase indicates an increase of PI(4,5)P2 on the membrane while the fluorescence decrease indicates a decrease of PI(4,5)P2 on the membrane; −20 mV = purple, 20 mV = red, 140 mV = green. (D, right) ΔF/F PLC FV with the fluorescence decrease (FV Down, net 5-phosphatase reaction, solid line) and the fluorescence increase (FV Up, 3-phosphatase reaction, dashed line, inset) separated. Data fit with a Boltzmann equation. All error bars are ± s.e.m; n ≥ 16. Some errors bars are smaller than the size of the symbols.

