Figure 4.
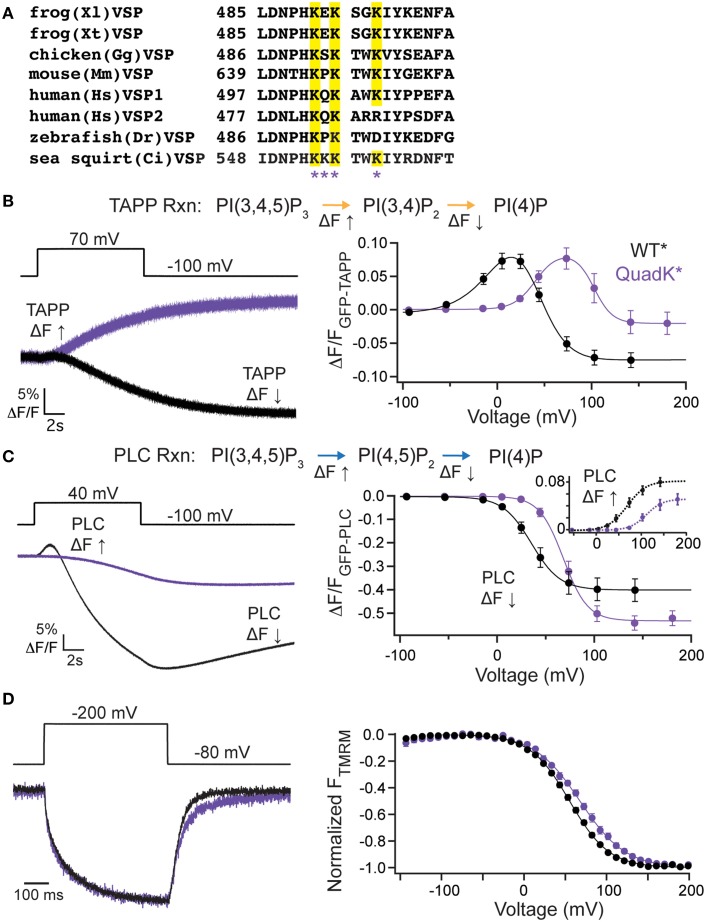
C2 domain positive charge cluster significantly shifts voltage-dependent activity. (A, left) Alignment of the fourth inactivated CBL from several species of VSP. Quadruple Lys mutant, quadK*, positions highlighted by asterisks. Conserved Lys shown in yellow. (B, left) Representative GFP-TAPP-PH trace during a step from an hp of −100 mV to +70 mV for WT* (black) and quadK* (purple). QuadK* shows significant levels of PI(3,4)P2 production while WT* shows predominantly PI(3,4)P2 depletion during a 70 mV step. TAPP-PH reaction listed on top. (B, right) ΔF/F TAPP FV. QuadK* significantly shifts the PI(3,4)P2 production and depletions to higher voltages (>40 mV, Table 1), n ≥ 6. Data fit with a double Boltzmann. (C, left) Representative GFP-PLC-PH trace during a step from an hp of −100 mV to +40 mV for WT* and quadK, colors as in (B). QuadK* again shows a different level of PI(4,5)P2 production as compared to wild type. PLC-PH reaction listed on top. (C, right) ΔF/F PLC FV with the fluorescence decrease (Down, net 5-phosphatase reaction) in solid lines and the fluorescence increase shown in inset with dashed lines (Up, net 3-phosphatase reaction). QuadK* significantly shifted the PI(4,5)P2 production and depletion to higher voltages (>30 mV, Table 1), n ≥ 7. Data fit with a Boltzman. (D, left) Representative TMRM fluorescence trace during a step from an hp of −80 to +200 mV for WT* and quadK*. Colors as in (B). Traces are normalized to the maximal fluorescence change. The voltage trace reports the actual voltage recorded during acquisition. QuadK* does not significantly influence the VSD activation kinetics while slowing the deactivation kinetics modestly. (D, right) Normalized TMRM FV. A small (12 mV) shift in the voltage dependence of VSD motions with quadK*. Data fit to single Boltzmann equations and normalized to the fit, n ≥ 10, WT* V1/2 = 55.1 ± 0.4, slope = 23.9 ± 0.4; quadK* V1/2 = 67.6 ± 0.7, slope = 27.4 ± 0.6. All error bars are ± s.e.m. Some errors bars are smaller than the size of the symbols.

