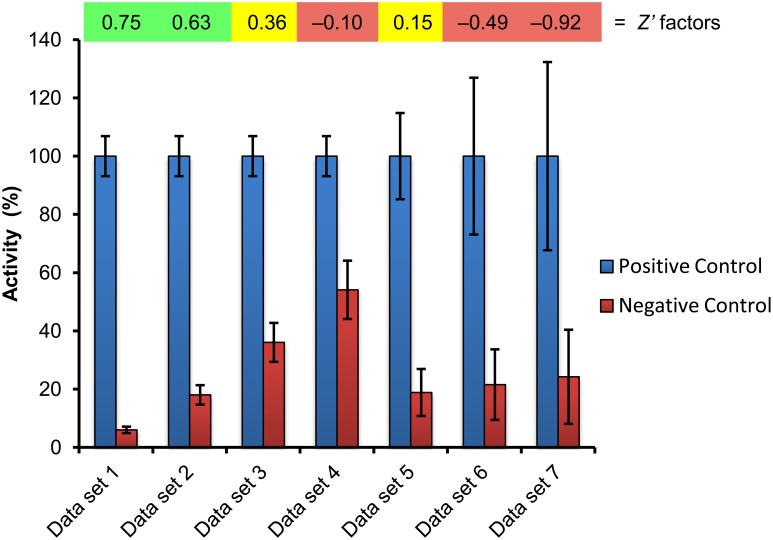
Figure 3.
Estimation of assay quality by Z′ factor determination. The positive and negative controls included with a screening plate (cf. Figure 4) were used to calculate the Z′ factor, which is shown above the corresponding data set. The values of data set 1 are from a real experiment recently published (Halder and Kombrink, 2015), and the resulting Z′ factor of 0.75 indicates that this is an excellent assay for screening (quantification of GUS activity). Gradual, hypothetical increase of the negative control value (data sets 2–4) reduces the screening window and correspondingly the Z′ factor, leading to marginal (Z′ = 0.36) and unacceptable (Z′ = −0.10) assay quality for screening purposes. Likewise, increasing variability of assay data leads to decreasing Z′ factors and assay quality (data sets 5–7). Green, yellow, red indicate excellent, marginal, and inacceptable assay quality, respectively.

