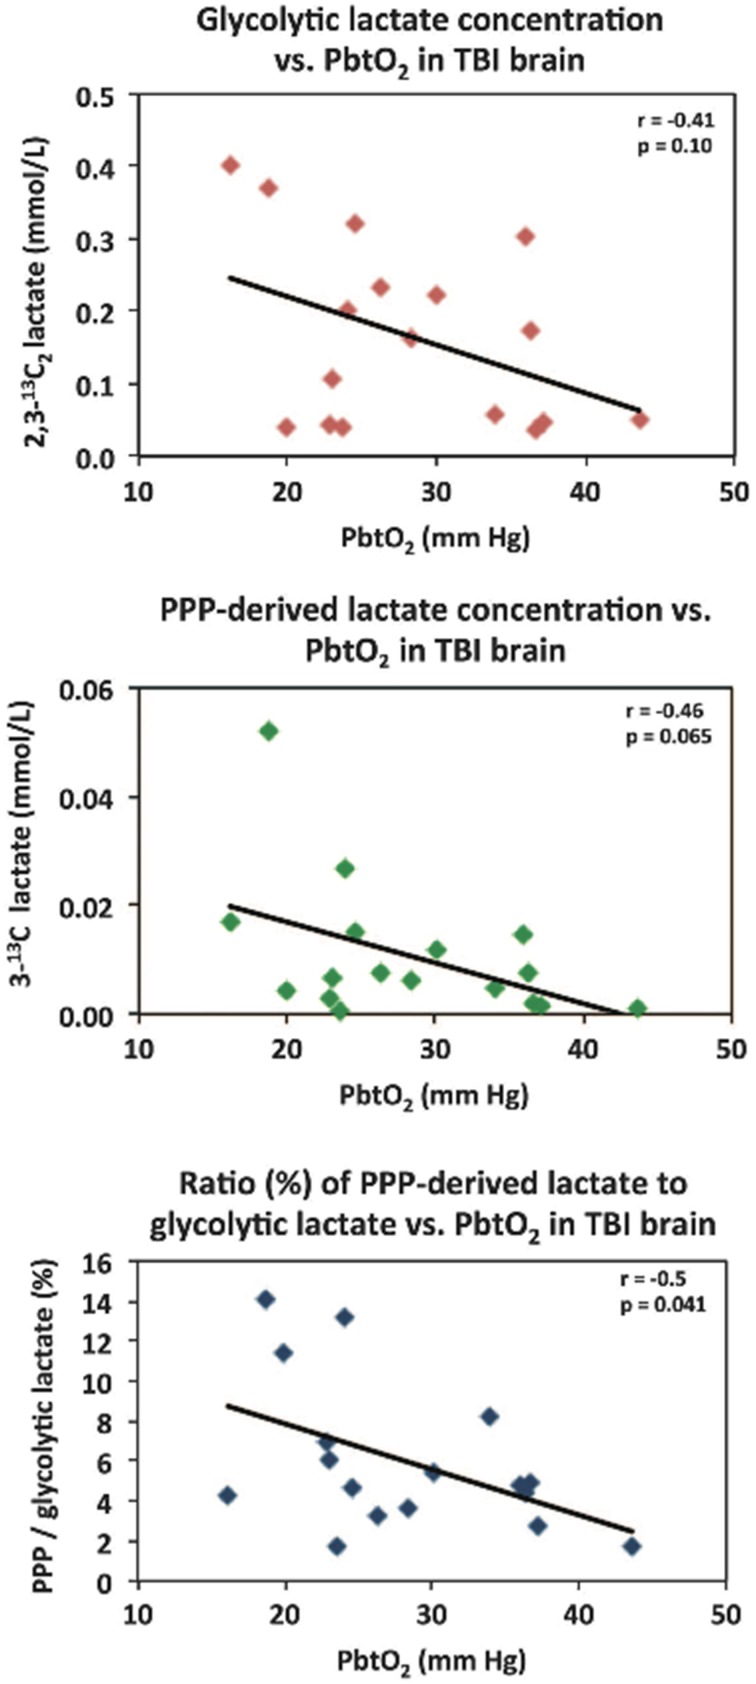
Figure 8.
Relationships in TBI brain for glycolytic lactate and pentose phosphate pathway (PPP)-derived lactate vs. PbtO2. Concentrations of glycolytic 2,3-13C2 lactate (upper panel) and PPP-derived 3-13C lactate (middle panel) plotted vs. PbtO2. Lower panel: ratio (%) of PPP-derived 3-13C lactate to glycolytic 2,3-13C2 lactate, plotted vs. PbtO2. Each data point represents the results of NMR analysis of the combined contents of 24 × 1 h of microdialysate collection vials from one microdialysis catheter, plotted against the corresponding PbtO2 concentration expressed in mmHg, measured using a Licox oxygen probe placed alongside the microdialysis catheter in the brain. Lines are fitted by linear regression (statistics shown are Pearson's correlation coefficient r and analysis of variance P–value). Data are from 13 TBI patients. Four of these thirteen had a second period of monitoring, making 17 data points in total for each correlation. Originally published by Jalloh et al. (2015) in J Cereb Blood Flow Metab 35: 111–120, and reproduced with permission of Nature Publishing Group.

