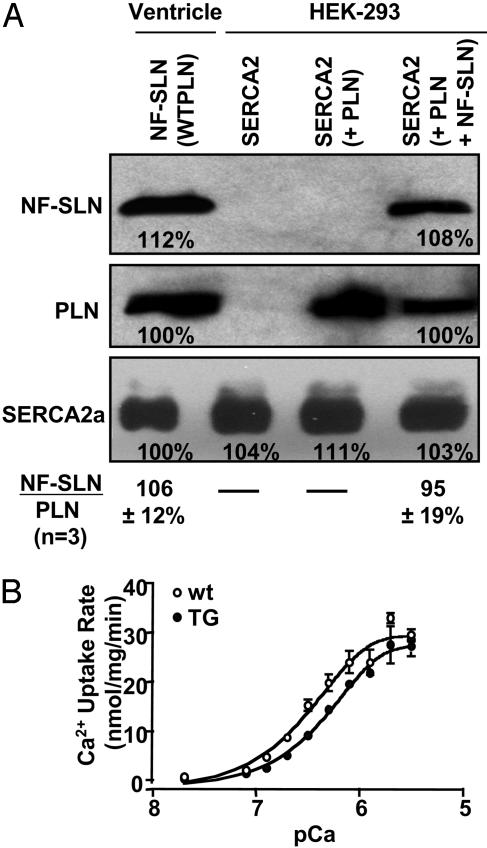
Fig. 2.
Relative quantification of NF-SLN expression in microsomal fractions from transfected HEK-293 cells and TG hearts. HEK-293 cells were grown to confluence in a 100-cm plate and transfected with 6 μgofPLN,6 μg of NF-SLN, and 8 μg of SERCA1a cDNAs. (A) After 48 h, microsomal fractions were isolated, and 7.5 μg of total protein was separated by SDS/PAGE and stained separately with the M2 antibody against NF-SLN and the 1D11 antibody against PLN. The ratio of NF-SLN band intensity to PLN band intensity averaged 95% (n = 3). Microsomal fractions were also isolated from hearts from 10-week-old TG mice, and Ca2+ transport activity was shown to be superinhibited (data not shown). Microsomal proteins (12.5 μg) were separated by SDS/PAGE and stained separately with antibody M2 against NF-SLN and with antibody 1D11 against PLN. The ratio of NF-SLN band intensity to PLN band intensity averaged 106% (n = 3). In the bottom row, identical aliquots were stained with the antibody 2A7-A1 against SERCA2a. The fact that the band intensity in each of the four lanes varied between 100% and 111% shows that SERCA2a content was comparable in all four samples. (B) Ca2+ uptake activity in cardiac ventricular homogenates prepared from TG (n = 3) or wt (n = 3) mice. Data are expressed as mean ± SEM.

