
Figure 2.
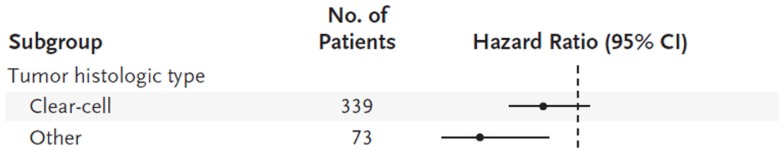
Hazard ratios (indicated by circles) with 95% confidence intervals (indicated by horizontal lines) are shown for subgroups of patients receiving interferon-α or temsirolimus.
Official websites use .gov
A
.gov website belongs to an official
government organization in the United States.
Secure .gov websites use HTTPS
A lock (
) or https:// means you've safely
connected to the .gov website. Share sensitive
information only on official, secure websites.
Hazard ratios (indicated by circles) with 95% confidence intervals (indicated by horizontal lines) are shown for subgroups of patients receiving interferon-α or temsirolimus.