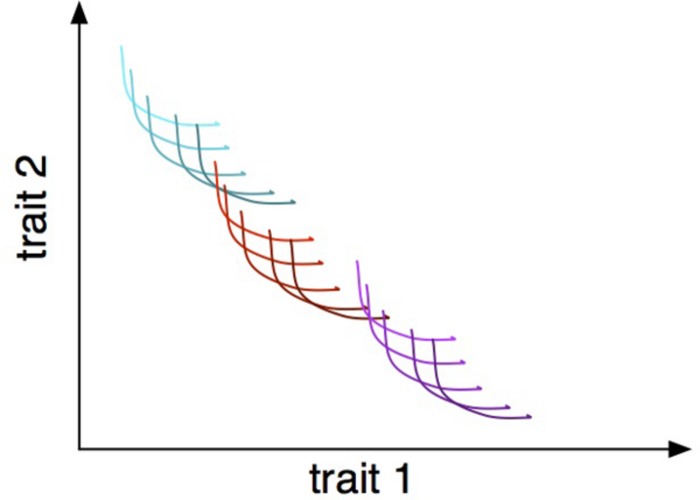
FIGURE 1.
Trade-offs between two traits at three hierarchical levels: within-individual phenotypic plasticity, represented as individual curves; within-species genetic variation, represented as differently shaded curves; and within-community interspecific variation, represented as different colored families of curves

