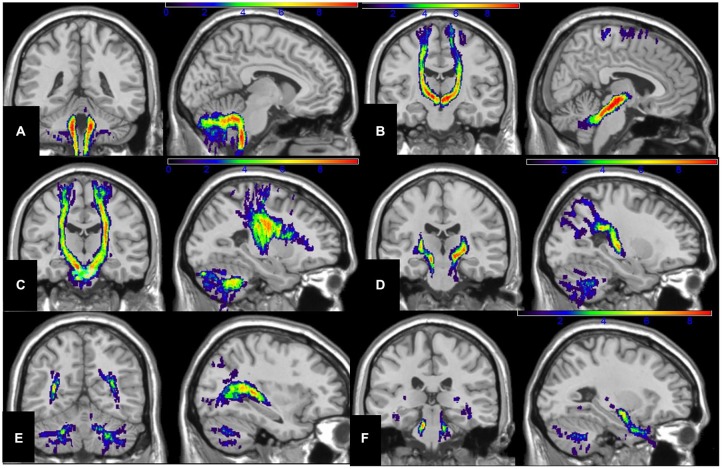
Figure 5.
Sagittal and coronal illustration of spatial-normalized MNI summary of the (A) spinocerebellar, (B) dentate-rubro-thalamo-cortical, (C) fronto-ponto-cerebellar, (D) parieto-ponto-cerebellar, (E) occipito-ponto-cerebellar, and (F) temporo-ponto-cerebellar are presented together with color-coded scale (blue→red; blue: 1–3 subjects, green; 4–6 subjects, yellow: 6–8 subjects, red: 8–10 subjects) that illustrates the regions of the tracts reconstructed in the number of the subjects (n = 10).

