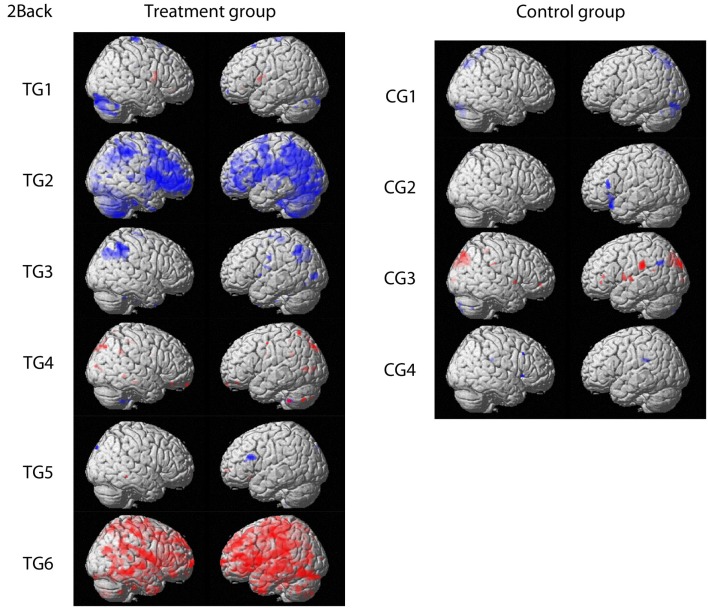
Figure 1.
Contrasts comparing baseline and post-training fMRI results for the treatment group and the control group, respectively. Activation increase is marked in red whereas decreased activation over time is highlighted in blue (p < 0.001 uncorrected; threshold: 10 voxels per cluster). Figures are shown in radiological convention.

