Figure 1.
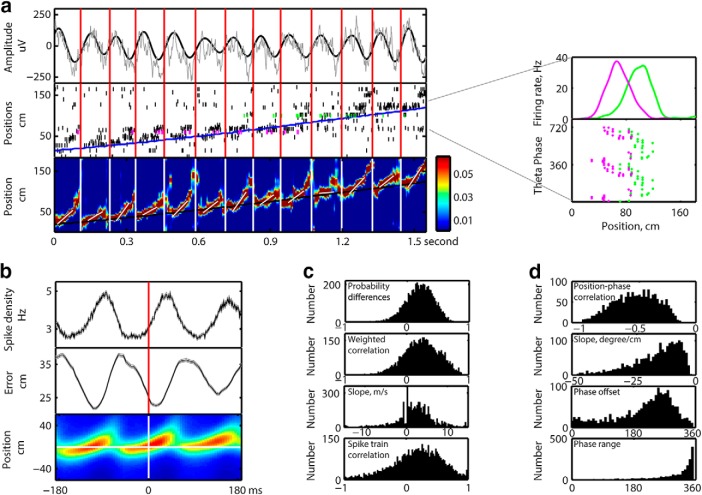
Individual theta sequences and single-lap phase precession. a, Left, Concurrent LFP (top panel, raw LFP in gray, 4–12 Hz bandpass filtered theta rhythm in black), spikes from 107 CA1 pyramidal cells ordered by place cells' peak firing positions along the track (middle, black bars; magenta and green represent the spikes from the cells in right panel), and theta sequences constructed from raw spikes (bottom, probability estimates were color scaled) during 1.55 s of the animal's running. Overlay white line indicates the speed of each theta sequence. The running trajectory of the animal was indicated as overlay blue (middle) or black line (bottom). The beginning and end of theta sequences were indicated as white (bottom) or red bars (other panels). Right, Examples of single-lap phase precession. Top, Two overlapping place fields. Bottom, Phase-position relationship of emitted spikes during the running lap shown in the left panel. b, Spike density of neuronal population (top), decoded errors (middle), and theta sequences (bottom) were theta modulated. c, Histogram of theta sequence strength measured by probability differences (first panel), weighted correlation (second panel), slope (third panel), and spike train correlation (fourth panel). d, Histogram of phase-position correlation (first panel), slope (second panel), phase offset (third panel), and phase range (fourth panel) of single-lap phase precession.

