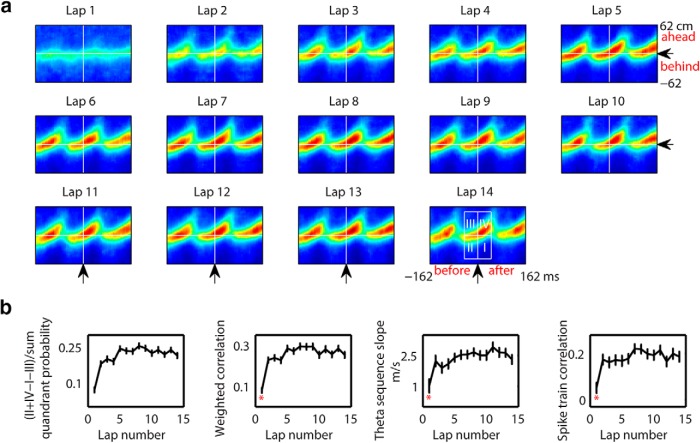
Figure 2.
Theta sequence structure emerged immediately after the first experience on the novel track using whole session decoding. a, Averaged decoded probabilities over 125 cm centered by the animal's current running position, aligned by the animal's current running direction during 325 ms centered by the mid-time point of theta sequence for each lap. Color scale is the same as in Figure 1a. b, Theta sequence strength changed significantly between the first lap and the following laps. First panel, Probability of (II + IV − I − III)/(I + II + III + IV) Quadrant in a 100 cm and ½ theta cycle window centered by the animal's current running position and the mid-time point of theta sequence on different laps. Second panel, Weighted correlations between time and decoded positions across laps. Third panel, Theta sequence slopes across laps. Fourth panel, Spike train correlations across laps. *Lap that was included in all significant pairs of laps at the 0.05 level.

