Figure 4.
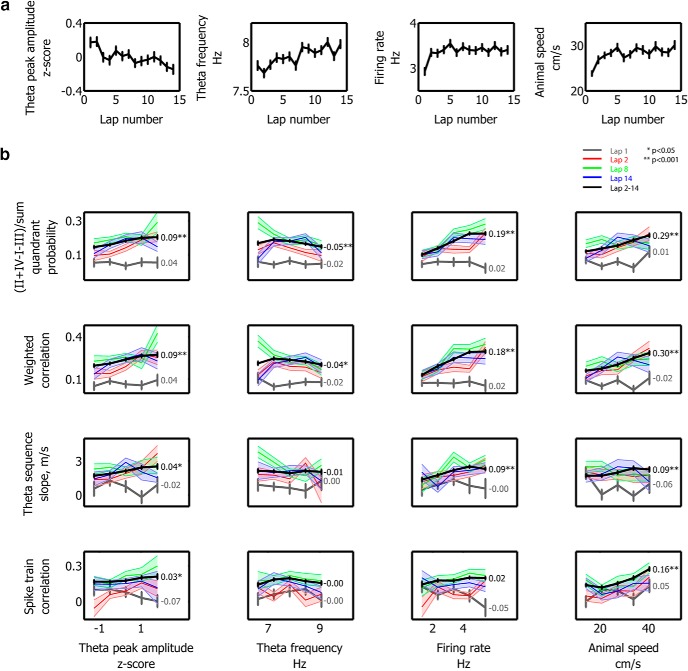
The variability of theta peak amplitude, theta instantaneous frequency, overall firing rate, and the animal's running speed between laps was not sufficient to account for the emergence of theta sequence structure after the first lap. a, Lap-by-lap changes of z-scored theta peak amplitude (first panel), instantaneous theta frequency (second panel), place cell overall firing rates (third panel), and the animal's running speed (fourth panel). b, Relationship between the above variables (four columns) and theta sequence strength under four different quantification methods (rows). Gray represents lap 1. Red represents lap 2. Green represents lap 8. Blue represents lap 14. Black represents laps 2–14. Shaded area and error bar indicate SEM. Text represents correlation value. *p < 0.05. **p < 0.001.

