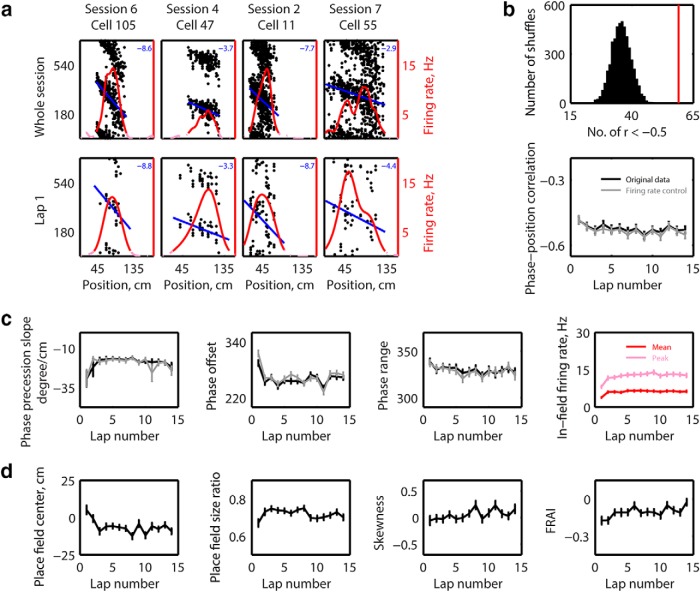
Figure 6.
Individual place field demonstrated strong phase precession on the first experience on a novel track. a, Phase precession from four different place cells. Each spike has been plotted out twice on the corresponding theta phase and the phase plus 360 degrees for visualization purpose. Top, Spikes from the whole session. Bottom, Spikes during the first lap; only spikes within the boundary of whole session place field or single-lap place field are shown. Red solid line indicates firing rate >1 Hz. Red dashed line indicates firing rate <1 Hz. Blue line indicates fitted line of phases with positions. Text on the upper right corner indicates the fitted slope. b, Top, Distribution of number of strong phase precessions (r < −0.5) from 5000 shuffles of 139 stable place fields. The 59 place fields on the first lap demonstrated strong phase precession (red line). Bottom, Pearson's linear correlations between animal's running positions and shifted theta phases of emitted spikes across laps. Black represents original data. Gray represents firing rate control. c, Phase precession slope (first panel), phase offset (second panel), phase range (third panel), in-field mean (red), and peak (pink) firing rate (fourth panel) of 139 stable place fields across laps. d, Place field center of mass shift (first panel), ratio of size change (second panel), skewness (third panel), and FRAI (fourth panel) across laps in reference to the whole session place field.

