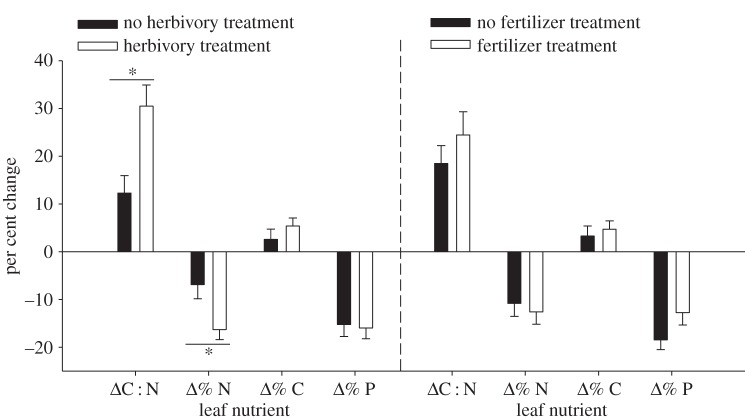
Figure 1.
Change in C : N, % C, % N and % P content of red alder leaves from trees given a herbivory treatment versus control trees (left-hand side), and trees given a fertilizer treatment versus control trees (right-hand side). Significant comparisons (t-tests p < 0.05) between herbivory treated and control trees indicated by a star.

