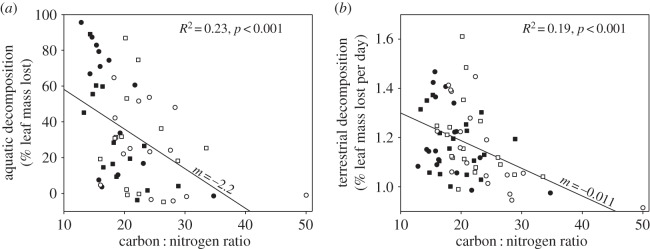
Figure 4.

Effects of innate and experimentally induced variation in C : N of red alder leaves on the leaf decomposition rates in streams (a) and forest soil (b). Carbon : nitrogen ratios of leaves at the time of leaf pack deployment after the implementation of a herbivory treatment (hollow) versus control (filled) and a phosphorus fertilizer treatment (circles) versus control (squares). Coefficients of determination and two-tailed p-values are reported for the entire dataset.
