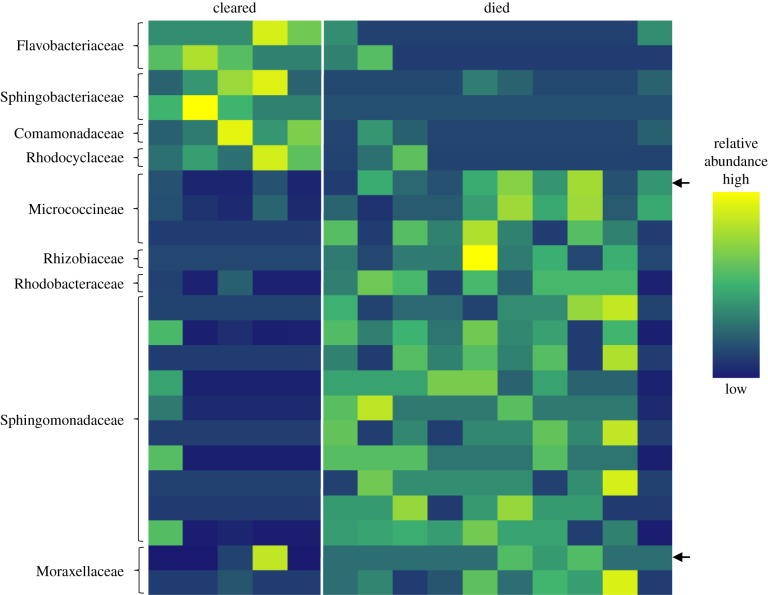
Figure 4.
Heat map of the relative abundances of indicator OTUs from indicator species analysis associated with Atelopus zeteki 3 days prior to Bd exposure that cleared Bd infection or died of chytridiomycosis. Rows indicate unique OTUs and columns indicate individual frogs. Family level taxonomic classification is shown for each OTU. Arrows are indicator OTUs that were detected both 3 days prior to and 28 days after Bd exposure.

