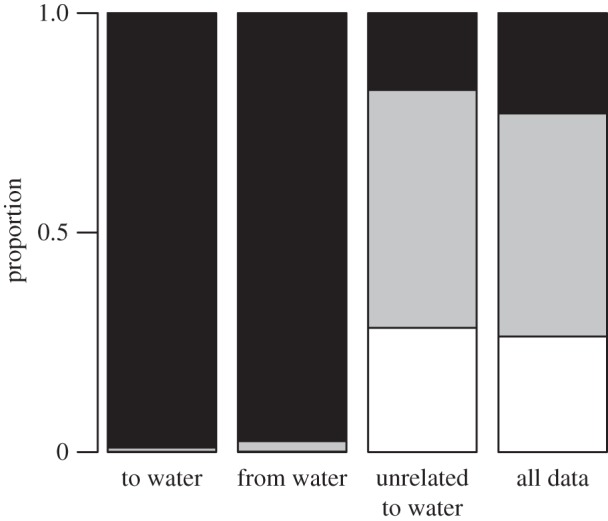
Figure 2.

Stacked bar plots showing the proportion of incremental movement (from 521 980 total net displacements across all individuals) in the different behavioural modes by path segment type and for all data. Movement modes are coloured as: white, Mode 1; grey, Mode 2; black, Mode 3. See the electronic supplementary material for corresponding plots for each individual separately.
