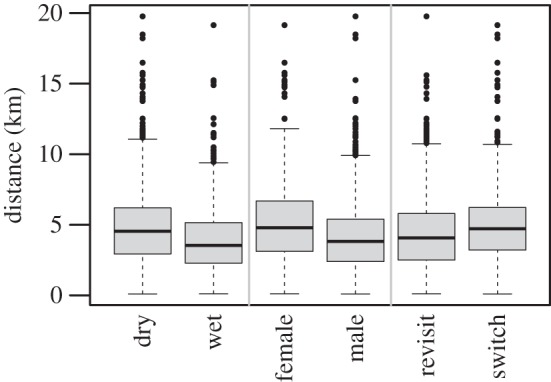
Figure 3.

Tukey box plots of the distances from the LBCP to the chosen waterhole, by different categories of the covariates used to model these distances (compare with results shown in table 2). Vertical grey bars delineate covariates. The largest distance recorded is excluded for clarity.
