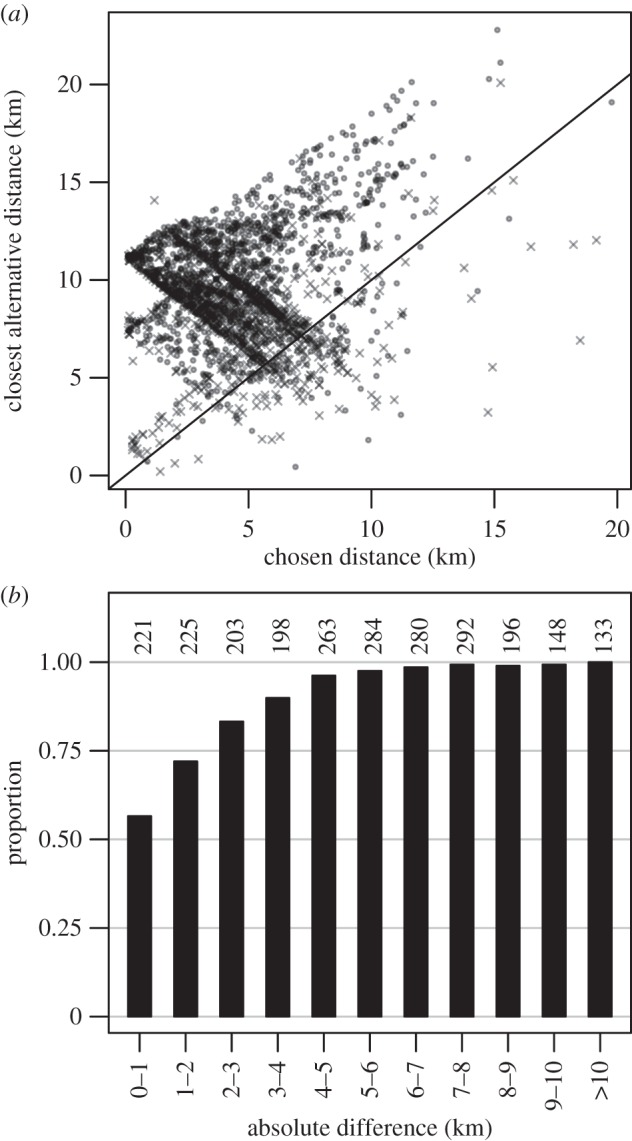
Figure 4.

(a) The closest alternative distance to a waterhole versus the distance to the chosen waterhole from the LBCP (grey circles demarcate revisits to the same waterhole and black×symbols switches to a different waterhole). Points below the diagonal are where the chosen waterhole was further from the closest alternative and are dominated by switching events. (b) The proportion of visits that were to the closest waterhole relative to the absolute difference in distances between the chosen and closest alternative waterhole. Distance differences are portrayed in 1 km bins with the exception of the final bin. Numbers above the bars show sample sizes for each bin.
