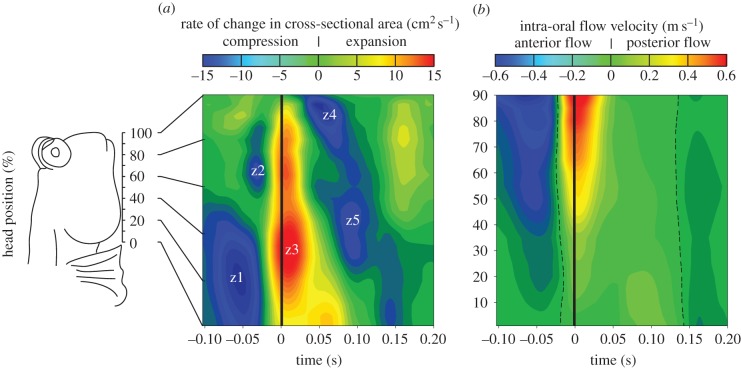
Figure 2.
Intra-oral rate of cross-sectional area change and flow velocity during prey capture in Periophthalmus barbarus. (a) Spatio-temporal-interpolated and averaged (two captures × four individuals) rate of change in the cross-sectional area as a function of the position along the head, showing successive compression and expansion events (z1–z5 delineate spatio-temporal zones of high compression or expansion; time 0, maximal mouth opening). (b) The corresponding intra-oral flow velocities along the anterior-to-posterior axis showing initially forward (blue colouring) and then backward motion (yellow to red colouring) of fluid with respect to the head (dashed line, zero flow velocity).

