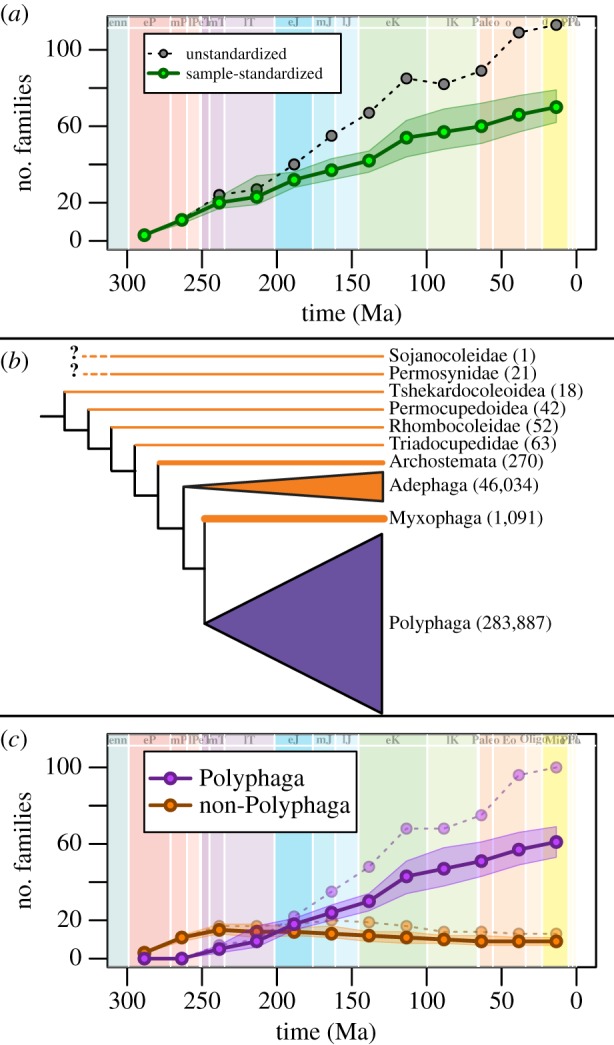
Figure 3.

Beetle family richness. (a) Unstandardized (black dashed line) and sample-standardized range-through-richness curves (solid green line) are shown. Green-shaded envelope surrounding sample-standardized richness indicates 95% CIs based on pseudoreplicate subsampling (see Material and methods). Extant taxa ranged through to the Recent. (b) A generalized phylogeny of Coleoptera, showing the four suborders and stem groups, and their extant species richness indicated in parentheses (from [22]; for extinct groups, species richness is the total number for the group). (c) Range-through family richness curves of the Polyphaga (purple, upper solid line) and non-polyphagan suborders (orange, lower solid line). As in (a), dashed lines represent unstandardized richness curves, and solid lines represent sample-standardized richness with 95% confidence envelopes. (Online version in colour.)
