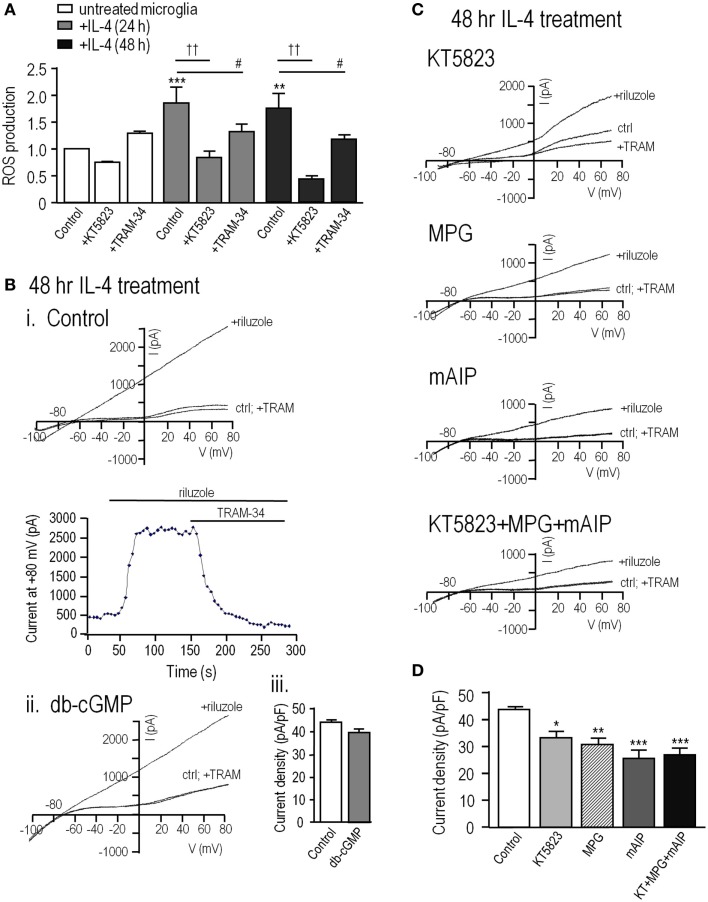
Figure 6.
In alternative-activated rat microglia, ROS production requires and potentiates KCa3.1 channel activity through the ROS-PKG-CaMKII pathway. To evoke alternative activation, primary rat microglia were treated with rat recombinant interleukin-4 (IL-4); 20 ng/mL for 24 or 48 h. (A) Summarized data show ROS production, detected by CM-H2DCFDA (see Methods) in untreated versus IL-4 treated microglia. Under each condition, separate batches of microglia were exposed to the PKG inhibitor (1 μM KT5823) or the KCa3.1 blocker (1 μM TRAM-34) for 24 or 48 h at 37°C. Values are expressed as mean ± SEM (n = 6 replicates experiments each), and compared using a two-way ANOVA with Tukey’s post hoc test. **p < 0.01 and ***p < 0.001 for non-activated versus IL-4 treated cells; #p < 0.05 and ††p < 0.01, for drug treatments, as indicated. (B) KCa3.1 currents were recorded in alternative-activated microglia 48 h after IL-4 treatment, using the perforated-patch configuration and the same solutions and voltage protocols as in Figure 1. (i) Representative currents from a cell before and after adding the KCa3.1 activator, 300 μM riluzole, and the KCa3.1 blocker, 1 μM TRAM-34. (ii) A cell pre-treated with 100 μM db-cGMP for 20 min at room temperature. (iii) Summarized data from a population study, in which the TRAM-34-sensitive KCa3.1 current amplitude is expressed as mean ± SEM (n = 4 cells each). The difference was non-significant based on Student’s t-test. (C). KCa3.1 currents were recorded from alternative-activated microglia, with and without the activator, riluzole, as in panel B. All drug pre-treatments were for 1 h at 37°C. From top to bottom, different microglia were treated with 1 μM KT5823; the ROS scavenger, 500 μM MPG; the CaMKII inhibitor, 1 μM mAIP; KT5823, MPG and mAIP. (D). Summarized data from a population study of experiments as in panel (C). The TRAM-34-sensitive KCa3.1 current is expressed as the mean ± SEM (n = 5 cells each), and was compared using a one-way ANOVA with Tukey’s post hoc test; *p < 0.05, **p < 0.01, ***p < 0.001.

