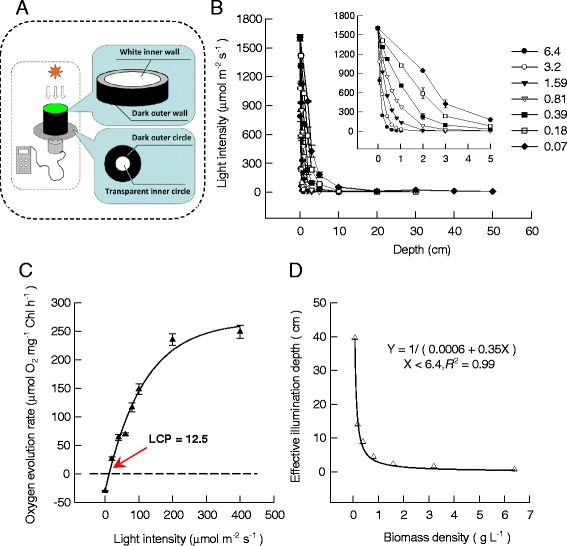
Figure 2.

The light attenuation inside the culture broth of suspended cultivation of Scenedesmus dimorphus . (A) The schematic diagrams of light intensity measurements under different depths of the culture broth. (B) The dependence of light attenuation on culture density as well as depth. Seven different culture densities were tested, viz. 6.4 (black circle), 3.2 (white circle), 1.59 (black down-pointing triangle), 0.81 (white down-pointing triangle), 0.39 (black square), 0.18 (white square), and 0.07 (black diamond). The measurements were carried out outdoors with natural light. Data were mean ± standard deviation of three measurements. (C) The relationship of oxygen evolution rate versus light intensity (black triangle). Data were mean ± standard deviation of three measurements. The light compensation point (LCP) was indicated by arrows. (D) The effective illumination depth of aqueous suspended S. dimorphus culture broth at different biomass densities (white triangle).
