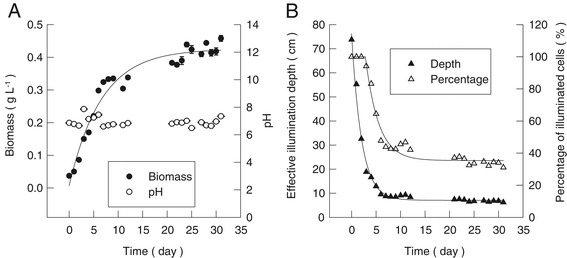
Figure 3.

The biomass increase, pH, and effective illumination depth of conventional aqueous suspended open ponds outdoors. (A) The biomass density (black circle) and pH (white circle) changes of the open pond outdoors. Data for biomass were mean ± standard deviation of six measurements for two independent open ponds (three measurements for each). Data for pH were mean ± standard deviation of two measurements for two independent open ponds (one measurement for each). (B) The effective illumination depth (black triangle) and percentage of effective illuminated algal cells (white triangle) at different days of cultivation in outdoor open ponds.
