
Figure 7.
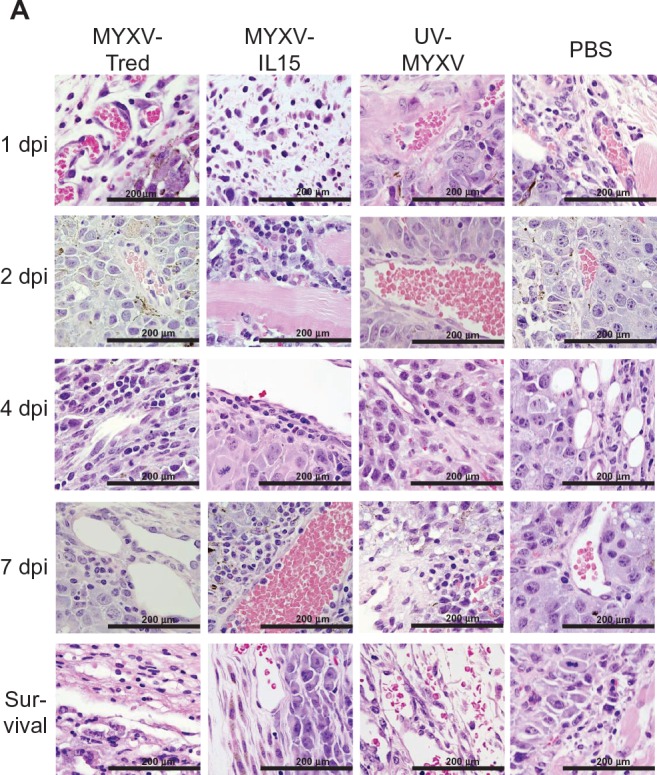
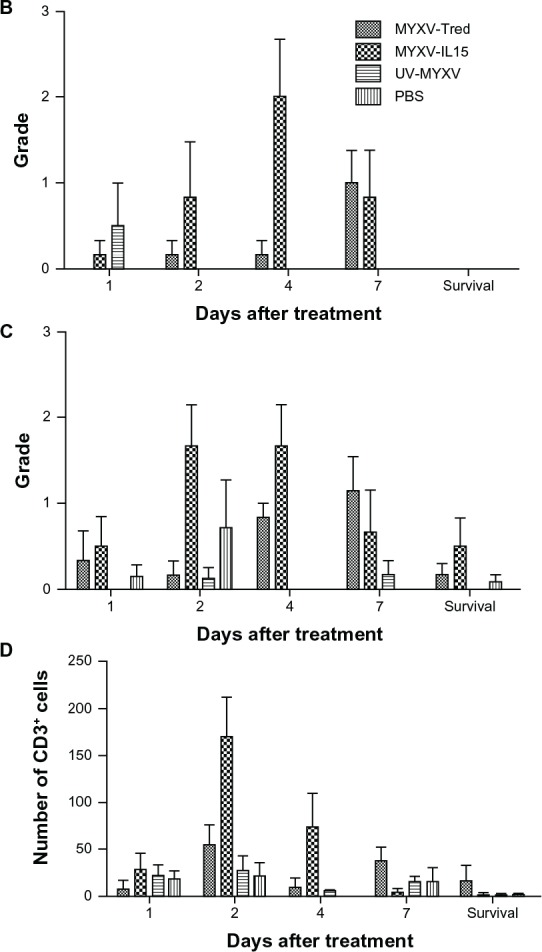
Lymphocyte infiltrates in and around melanoma tumors. (A) Histopathology of representative tumor sections at the indicated time points after intratumoral treatment (hematoxylin and eosin, 400×). In all treatment groups at early time points, tumors often were surrounded by dermal edema that contained mixed leukocytes (eg, MYXV-Tred and MYXV-IL15 1 dpi) and occasionally invaded the lumbar and gluteal skeletal muscle deep to the mass (eg, MYXV-IL15 2 dpi). Lymphocytes were often located surrounding vessels in the tumor (eg, MYXV-IL15 4 and 7 dpi; UV-MYXV 2 and 7 dpi; PBS 7 dpi), in the dermis (eg, MYXV-Tred 1 dpi; PBS 1 dpi), and at the junction of the tumor and the dermis (eg, MYXV-Tred 7 dpi; MYXV-IL15 survival; UV-MYXV survival; PBS 4 dpi and survival). The average grade of lymphocyte infiltrates (B) within tumors and (C) surrounding the tumors indicate an increase in lymphocyte numbers within MYXV-IL15-treated tumors 2 and 4 dpi. (D) The average combined number of CD3+ cells observed in the highest amounts within the tumor, at the junction of the tumor and the surrounding tissue, and within the surrounding tissue is shown.
Notes: Increased numbers of CD3+ cells are present within MYXV-IL15-treated tumors 2 and 4 dpi. Error bars represent standard error of the mean of three to twelve samples.
Abbreviations: CD3+, cluster of differentiation-3+; dpi, days postinoculation; MYXV-IL15, myxoma virus coexpressing murine interleukin-15 and tandem dimer Tomato red fluorescent protein; MYXV-Tred, myxoma virus expressing tandem dimer Tomato red fluorescent protein; PBS, phosphate-buffered saline; UV-MYXV, ultraviolet-inactivated myxoma virus.