
Figure 1.
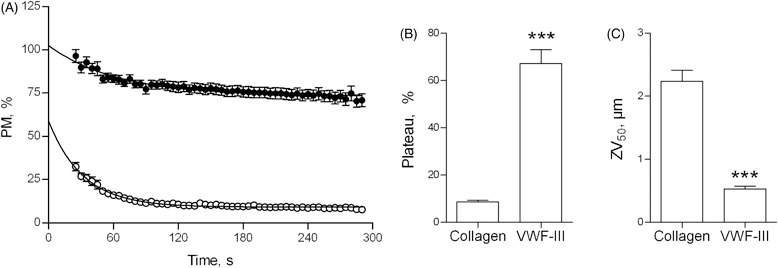
PM quantifies platelet adhesion under flow conditions. (A) Whole blood was perfused at 1000 s−1 over type I collagen fibers (○) or VWF-III (•) and images were acquired at 0.2 Hz for 5 min. Image processing yielded PM measurements throughout the 5-min perfusion, which are plotted vs. time. PM curves were modeled as exponential decays, yielding the parameter of Plateau (B) (see Supplementary material for details). End-point image analysis yielded ZV50 (C).