
Figure 3.
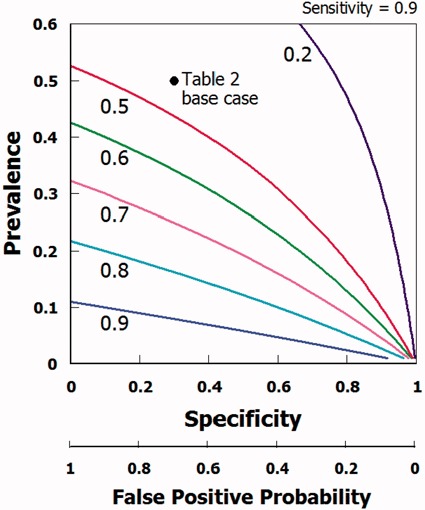
Regret (1 – PPV) as a function of prevalence ∏ and specificity for example in Table 4 assuming sensitivity held constant at 0.90.
Official websites use .gov
A
.gov website belongs to an official
government organization in the United States.
Secure .gov websites use HTTPS
A lock (
) or https:// means you've safely
connected to the .gov website. Share sensitive
information only on official, secure websites.
Regret (1 – PPV) as a function of prevalence ∏ and specificity for example in Table 4 assuming sensitivity held constant at 0.90.