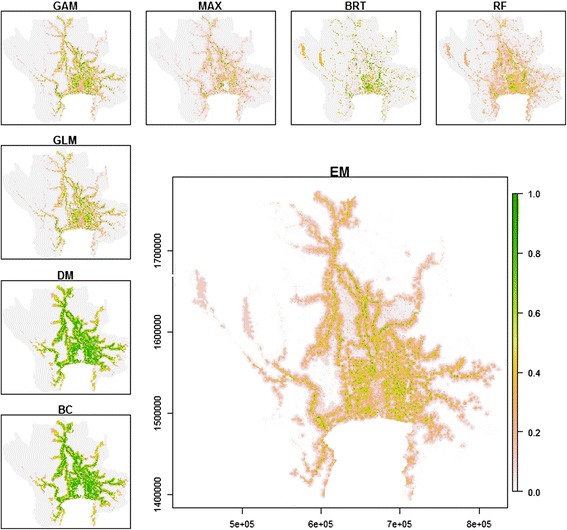
Figure 3.

Predicted suitability maps for flying fox colonies on the central plain of Thailand. The maps explained by Bioclim (BC), Domain (DM), Generalized Linear Model (GLM), Generalized Additive Model (GAM), Maximum Entropy Model (MAX), Boosted Regression Tree (BRT), and Random Forest (RF). The large map shows the Ensemble model (EM) output obtained by combining the 7 SDMs weighted by their respective predictive performance.
