Figure 4.

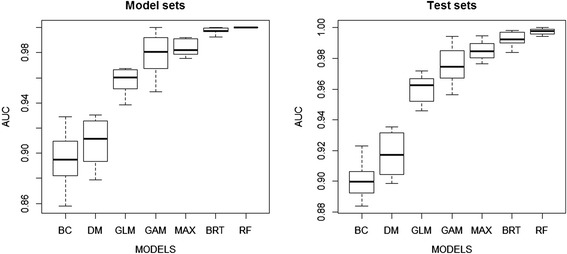
The predictive performance of 7 species distribution models. Box plots showing the predictive performance of 7 SDMs evaluated using the area under the curve (AUC) of ROC plots for the model sets (left) and test sets (right).

The predictive performance of 7 species distribution models. Box plots showing the predictive performance of 7 SDMs evaluated using the area under the curve (AUC) of ROC plots for the model sets (left) and test sets (right).