Figure 2.

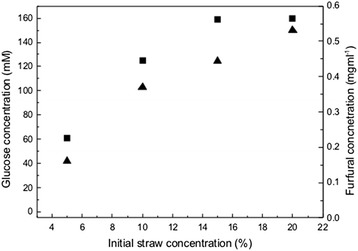
Concentration of glucose (squares) and furfural (triangles) present in wheat straw hydrolysates made as described in the ‘ Methods ’ section with an increasing concentration of initial straw.

Concentration of glucose (squares) and furfural (triangles) present in wheat straw hydrolysates made as described in the ‘ Methods ’ section with an increasing concentration of initial straw.