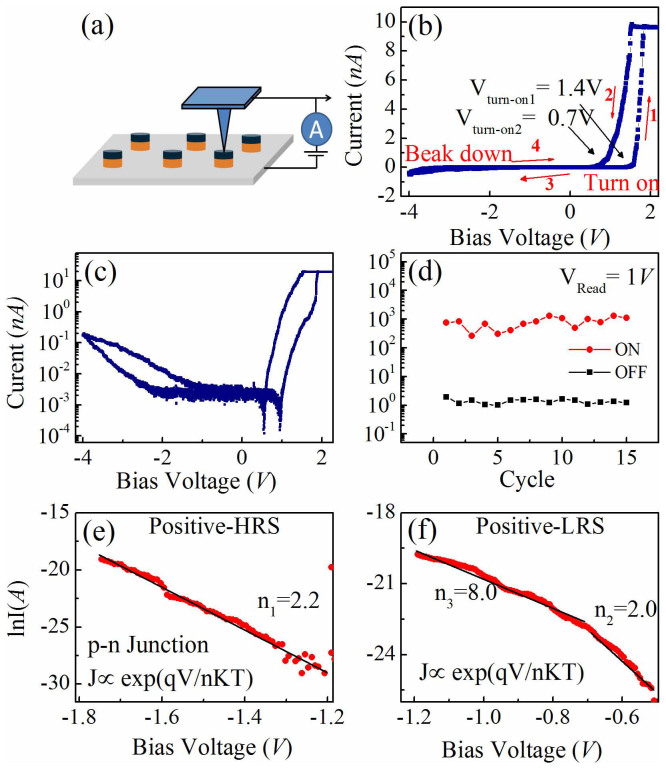
Figure 5. The local conductivity measurement on a single nanocapcitor cell by C-AFM.
(a) The schematic diagram for the measurement devices; (b) local I–V curves at a maximum bias voltage of 4 V, showing both a large rectification and a resistive switching behaviors; (c) the replotted I–V curve in a semi-logarithmic style; (d) 15-cycles endurance test, with a readout voltage of at 1 V; (e, f) Ln(I)-V cures for both HRS (e) and LRS (f) at the positive bias range, which are fitted to the p-n conduction exponential relation.

