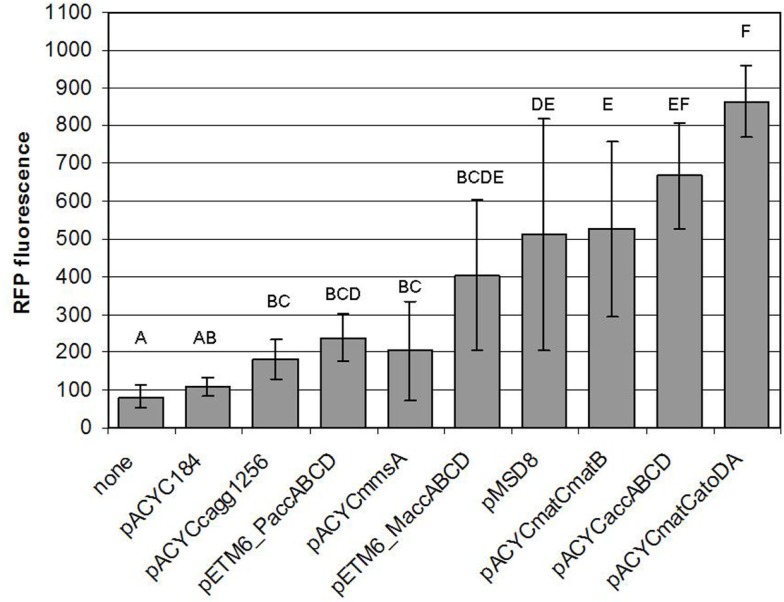
Figure 13.
Comparison of the malonyl-CoA levels produced by various constructs. Fluorescence observed at OD = 0.6, generated by pBFR1k_RFP_8FapR upon induction of the corresponding producer plasmid with 1 mM IPTG in a BL21DE3 host is depicted. Na-malonate was added for pACYCmatCmatB and pACYCmatCatoDA, and β-alanine was administered for pACYCmmsA and pACYCcagg1256. Each letter represents a value significantly differing from the others [i.e., if two value were found to significantly differ from each other (p < 0.05), then the letters corresponding to their bars do not overlap].

