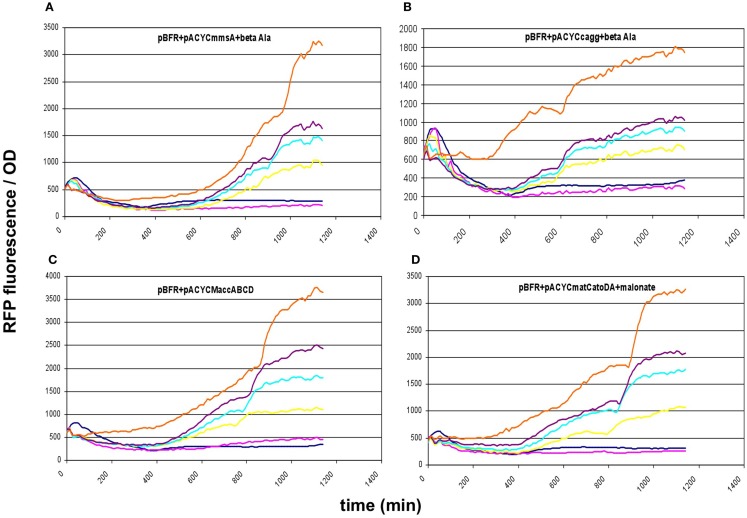
Figure 6.
Fluorescence response of BL21DE3 cells carrying pBFR1k_RFP_8FapR sensor plasmid and (A) pACYCmmsA, (B) pACYCcagg1256, (C) pACYCMaccABCD, or (D) pACYCmatCatoDA. The medium was supplemented with β-alanine for pACYCmmsA and pACYCcagg1256, and with Na-malonate for pACYCmatCatoDA. Colors indicate the concentration of IPTG used for induction: dark blue: 0.01 mM; magenta: 0.1 mM; yellow: 0.3 mM; cyan: 0.6 mM; purple: 1 mM; orange: 10 mM.

