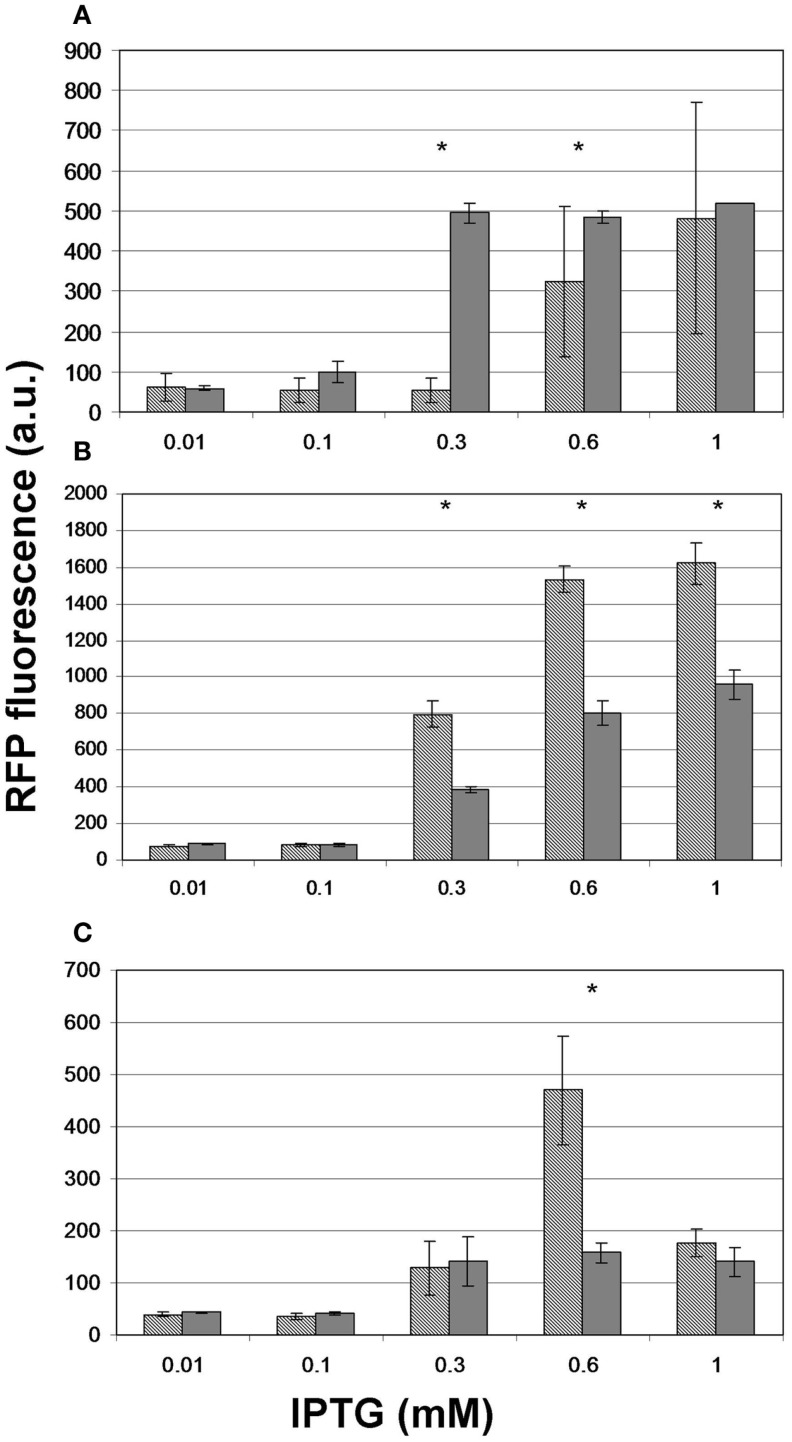
Figure 8.
The effect of administering the substrate on the level of fluorescence obtained upon induction of malonyl-CoA production. Hashed bars represent the effect of IPTG on the fluorescence obtained at OD = 0.6 with constructs (A) pACYCmatCmatB, (B) pACYCmatCatoDA, and (C) pRSFmmsA. Gray bars depict the peak fluorescence detected when inducing the same constructs in the presence of their substrate: Na-malonate for matCmatB and matCatoDA and β-alanine for mmsA. The sensor plasmid was pBFR1k_RFP_8FapR for (A,B) and pCFR for (C). Asterisks indicate a significantly different fluorescence caused by the substrate (p < 0.05).

