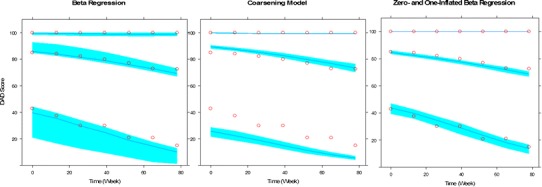
Fig. 1.

Visual predictive check for the models of disability assessment of dementia (DAD). In each panel, the upper, middle, and lower profiles indicated by the open circles represent the 95th, 50th, and 5th percentiles of the observed data. The upper, middle, and lower curves indicated by the lines are the median model-based prediction for the 95th, 50th, and 5th percentiles. The shaded areas are the 90% confidence intervals of the corresponding percentiles of the simulations based on the model
