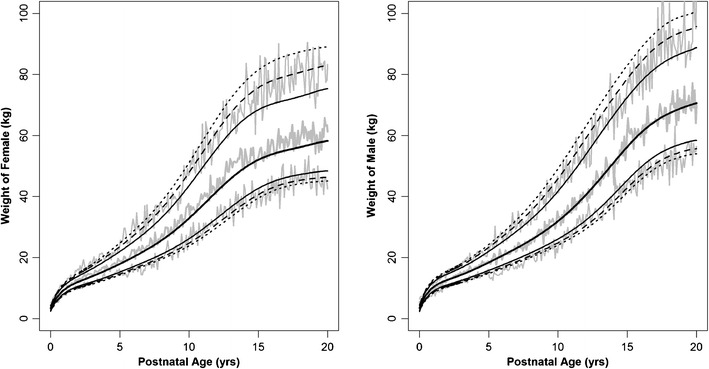
Fig. 1.

Age-matched weight in male and female infants, children, and adolescents between newborn and 20 years of age. The middle gray line represents the median and the outer gray lines are 95% prediction interval of the 10,000 simulated weights by the age. The CDC data are represented by black lines: median;
  , 80% confidence interval (CI);
  , 90% CI;
  , 95% CI of CDC growth charts. Source data from Center for Disease Control
