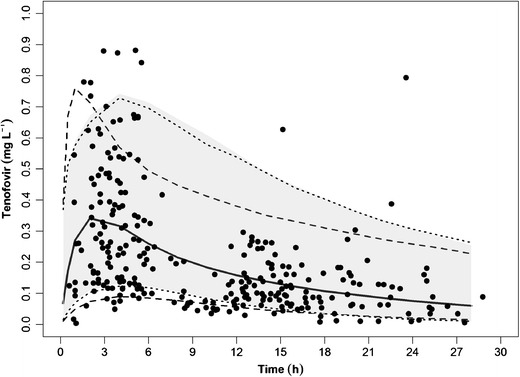
Fig. 4.

Simulation of tenofovir concentrations in 1,000 pediatric patients between the age of 5 and 19 years, showing 95% prediction intervals (dashed lines) and median (solid line) based on population pharmacokinetic model of tenofovir. The dotted lines and shaded areas are 95% prediction intervals for newborn to 5 years based on weights simulated from the CDC and WHO, respectively. Actual data from Bouazza et al. (21) are represented by filled circles
