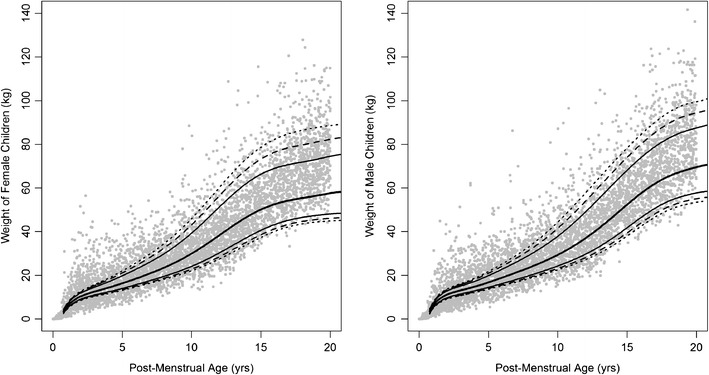
Fig. 5.

Age-matched weight in male and female pediatrics 0 to 18 years in age based on equations from Sumpter and Holford (15). Points represent simulated age-matched weight. The CDC data are represented by black lines:  , median;
  , 80% confidence interval (CI);
  , 90% CI;
  , 95% CI of CDC growth charts. Source data from Center for Disease Control
